

Black Friday and Cyber Monday are right around the corner, and the smartest brands are already thinking beyond the weekend. The real value of BFCM isn’t just in how much you sell, it’s in what you learn afterward.
By setting up these key ThoughtMetric reports before the rush, you’ll have all the data you need to understand exactly what worked once the dust settles.
Here are the five reports you’ll want ready to go the moment BFCM ends.
1. Channel & Ad Attribution
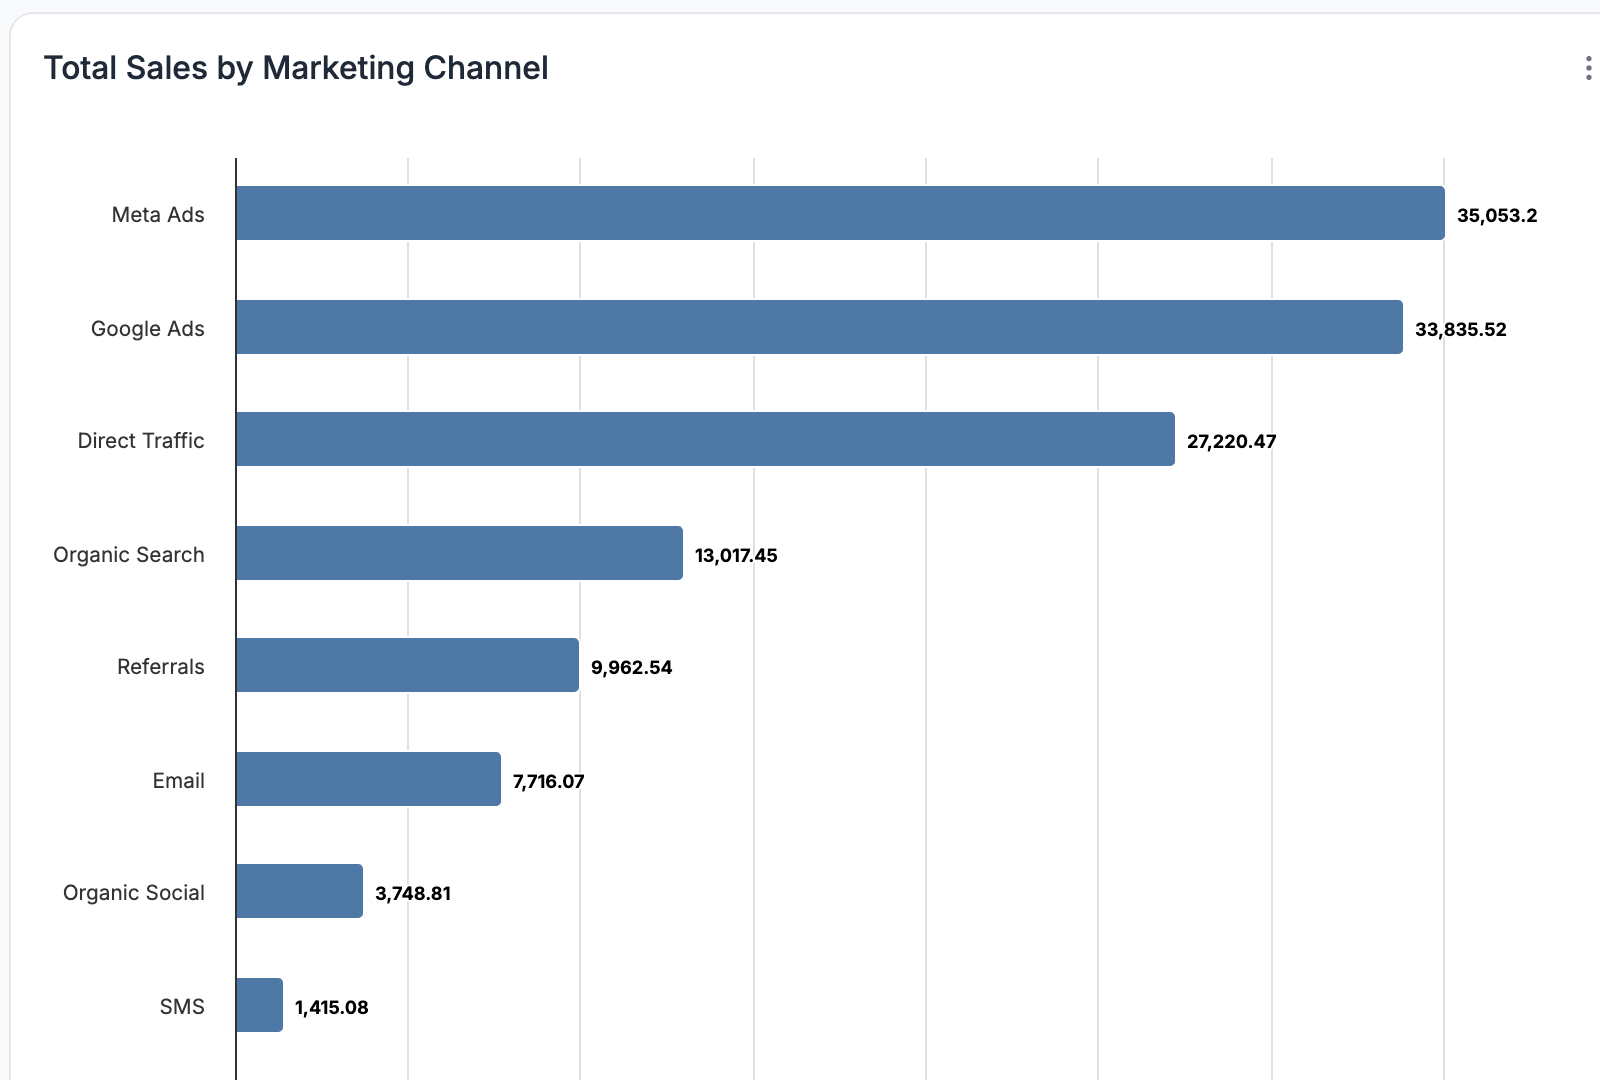
Channel & ad attribution in ThoughtMetric helps you see exactly where conversions come from, all the way down to the channel, campaign, ad set, and ad level.
Use the Multi-Touch Attribution model to see how all touchpoints contributed to the purchases. You’ll uncover how every campaign, creative, and channel worked together during the busiest shopping weekend of the year.
2. New vs. Returning Customers
This report shows how much of your BFCM revenue came from new versus returning buyers. Setting it up before the sale ensures you can easily track customer growth once the weekend is over.
3. Product Attribution
With Product attribution, you’ll see which items drove the most revenue, which ones converted first-time buyers, and how each product performed across different marketing channels.
4. Product Bundles
The Product Bundles report helps you see which products were most frequently purchased together during BFCM. Reviewing it after the sale gives you valuable insight into natural buying behavior and pairing trends you can use in future campaigns.
5. Time Comparison (BFCM vs. Prior Periods)
The Time Comparison view provides instant context by showing how this November and December performed against last year, highlighting year-over-year growth in revenue, order volume, and more.
Making Sense of the Results
Once the BFCM rush is over, it’s worth taking a step back to see what really worked. These five reports in ThoughtMetric give you a clear picture of your results across every channel, product, and customer segment.
Use them to pinpoint which ads drove the most impact, which products resonated with new buyers, and how this year’s performance compared to last. The insights you gain now will guide smarter planning for an even stronger year ahead.
FAQs
Does ThoughtMetric show ad-level performance?
Yes. You can view attribution at the channel, campaign, ad set, and ad level, giving you full visibility into which ads and creatives are driving conversions.
How does Product Attribution work in ThoughtMetric?
Product Attribution shows which products generated the most revenue, which ones attracted new customers, and how each performed across your marketing channels.
Product Attribution shows which products generated the most revenue, which ones attracted new customers, and how each performed across your marketing channels.
Can I compare this year’s BFCM to last year?
Yes. The Time Comparison feature lets you see year-over-year results for revenue, orders, and more.
Yes. The Time Comparison feature lets you see year-over-year results for revenue, orders, and more.

.png)
