Number
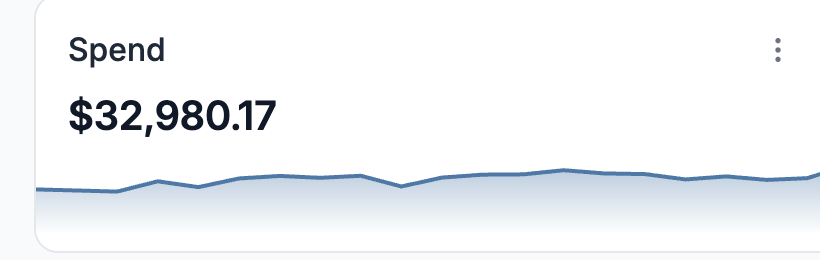
Single metric value
Analytics
Track marketing performance
Measure ROAS, CPA, and more
Measure creative performance
Measure loyalty and LTV
Measure product performance
Data & Integrations
Bring your attribution data to Claude and ChatGPT
Integrate with all your e-commerce tools
Send conversion data back to ad platforms
Run "How did you hear about us?" surveys
Reporting
Organize Data Your Way
"Since switching to ThoughtMetric, we've been able to reallocate budget to the top-performing channels with confidence, which improved ROAS by 25%."
— Ninja MTB
Book a DemoResources
How brands grow with ThoughtMetric
Tips, guides, and industry insights
Get Help
Documentation and support guides
Get in touch with our team
Comparisons
Simpler setup, easier to use
Faster time to value
Deeper insights, broader integrations
"We looked at a number of competitors in the space, but ultimately chose ThoughtMetric because of its easy-to-understand interface and the support offered during and after implementation."
— SportRx
Book a DemoPartners
Earn commission for referring your network
Become an agency partner
Featured Partners
Performance marketing agency
Shopify development & optimization
Full-service digital marketing agency
"With ThoughtMetric, we were able to refine our analytics and provide verifiable proof of the revenue we were driving in a previously underperforming area of the business."
— Impakt Results
Book a DemoCustom Reports
See only what you need with flexible, fully customizable reporting.
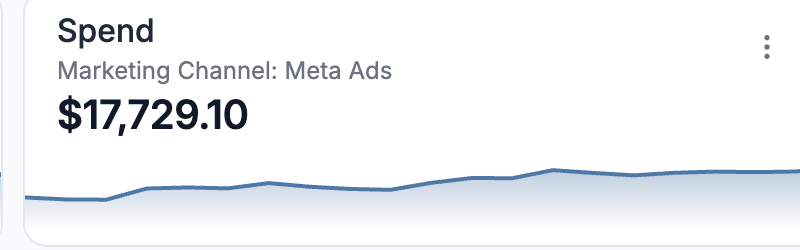
Instantly View Your Key Metrics From Your Most Important Channels
Build views that pull forward your most important performance signals.
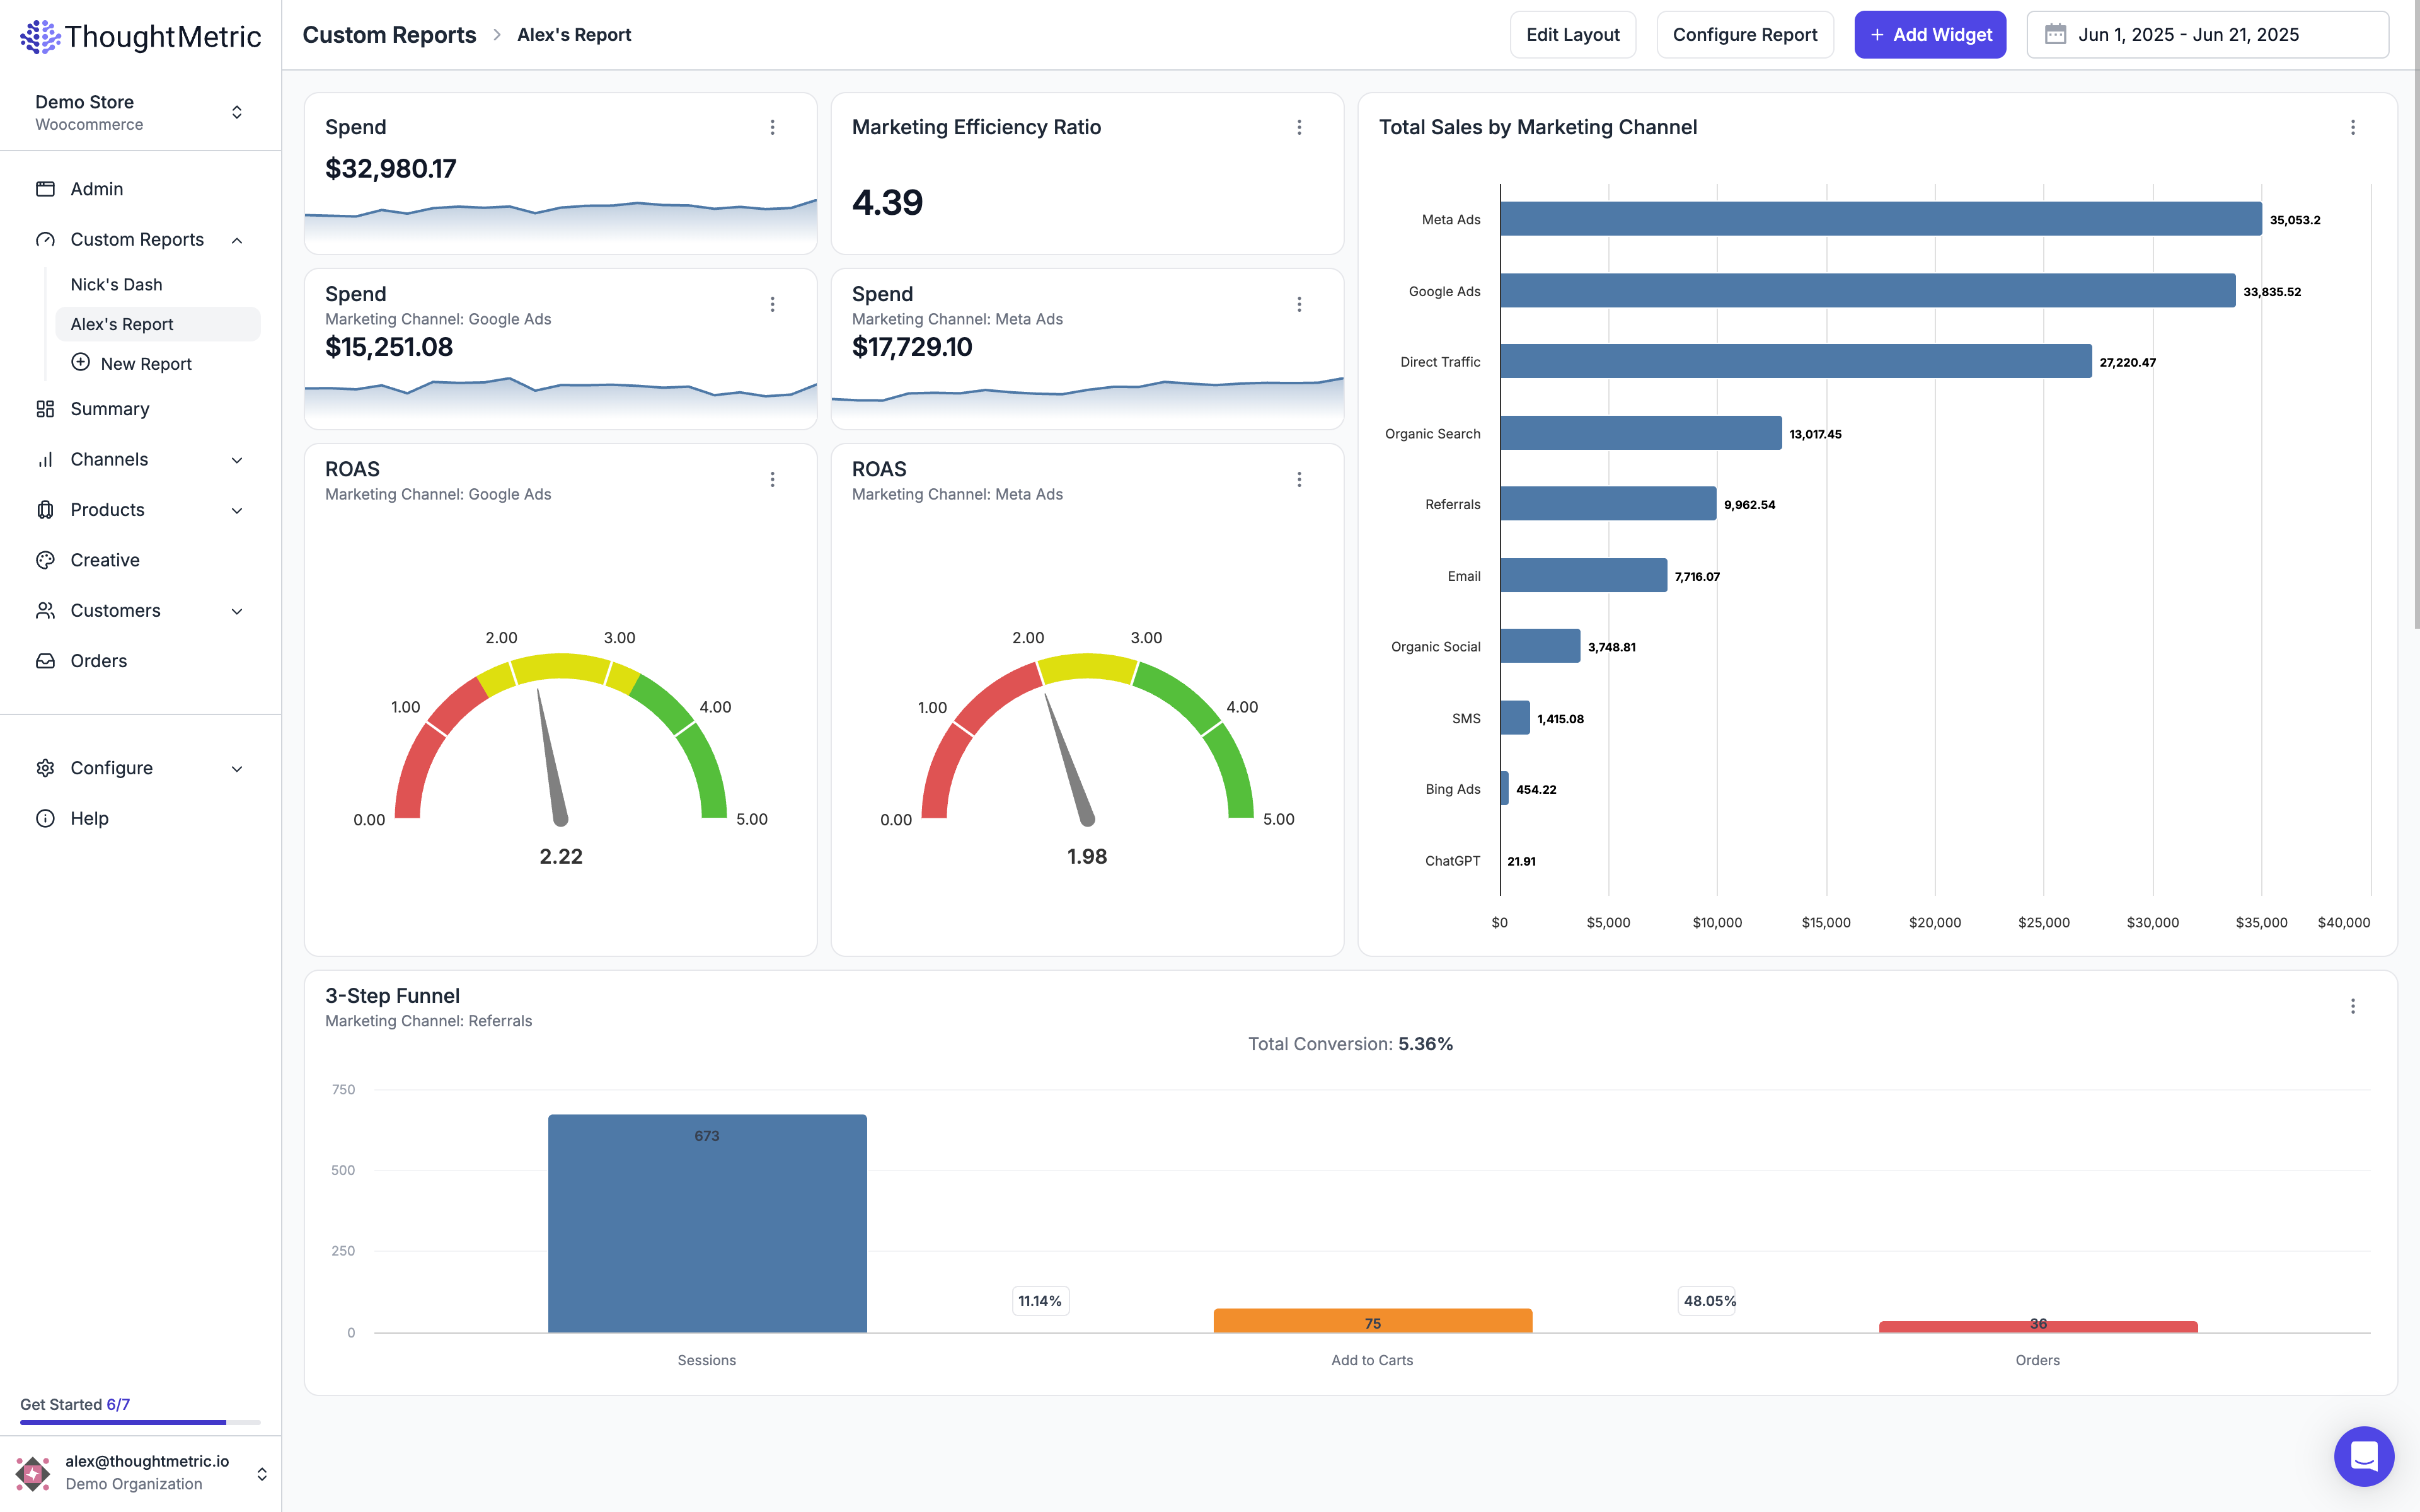
Views for Every Role On Your Team
Give every team member their own dashboard.
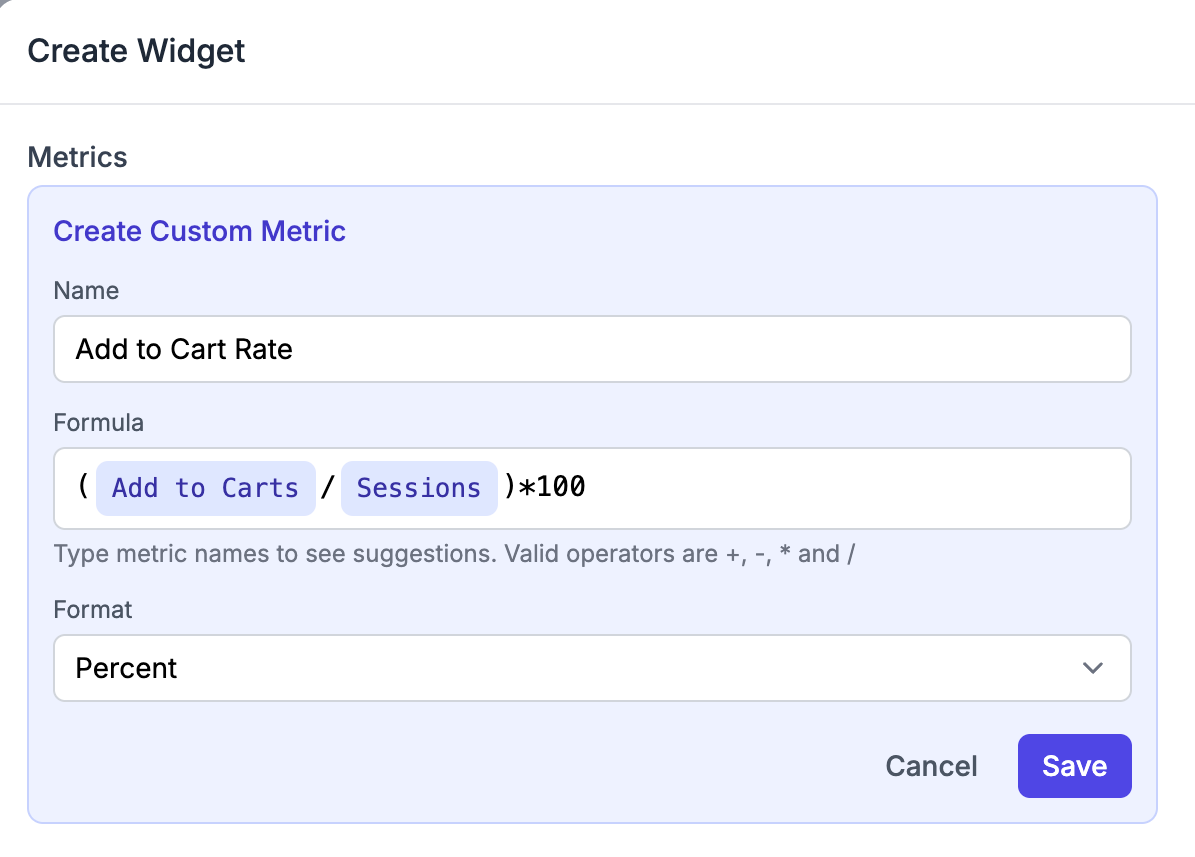
Build KPIs That Match How Your Business Works
Create custom KPIs with simple equations using existing ThoughtMetric data points.
Move, Resize, and Arrange Widgets Effortlessly
Customize every inch of your dashboard with intuitive editing tools.
Single metric value
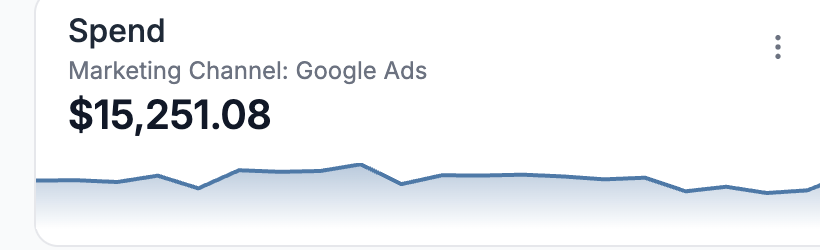
Metric with trend
Rows and columns
Trends over time
Filled trend area
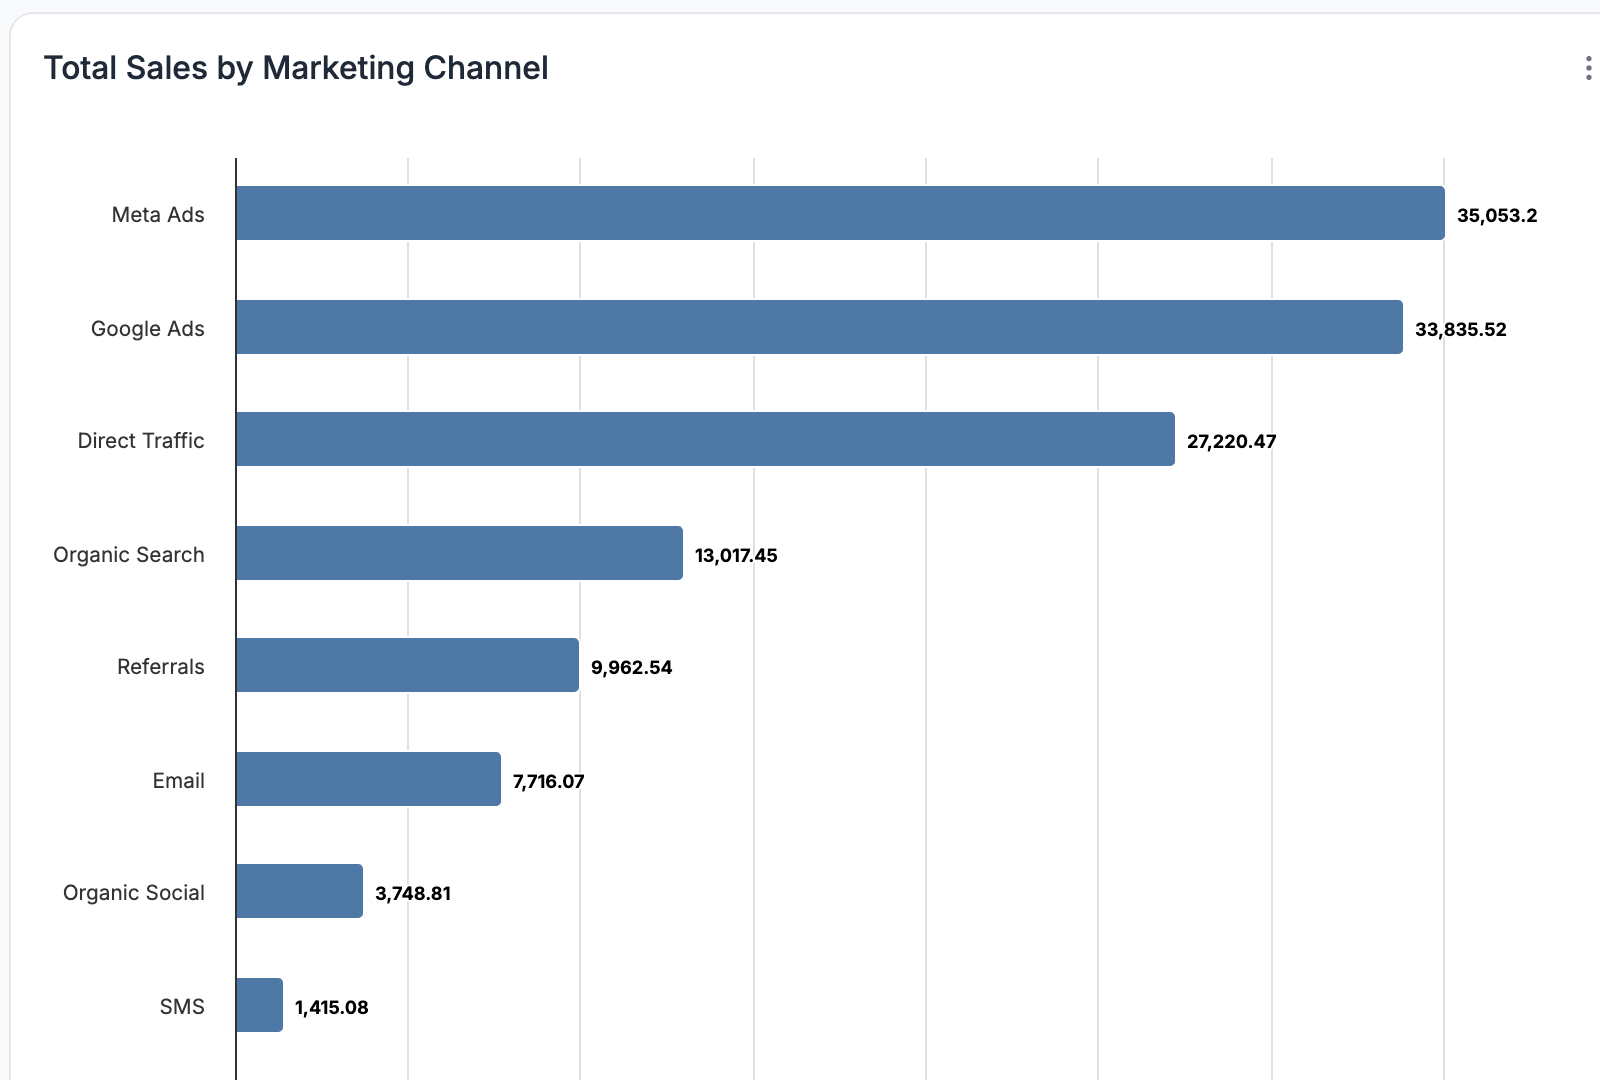
Compare categories
Compare horizontally
Show proportions
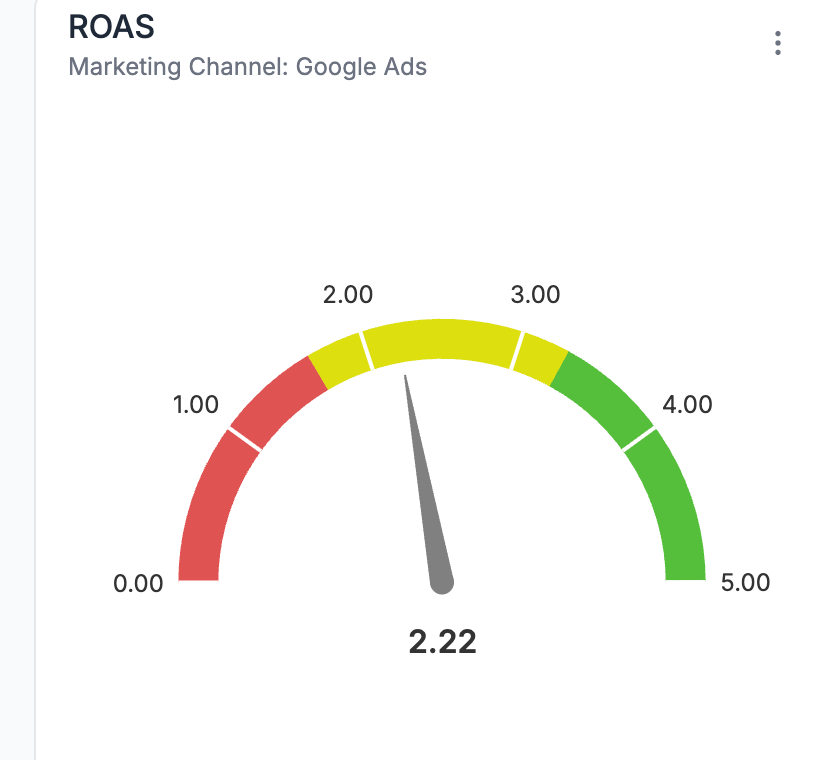
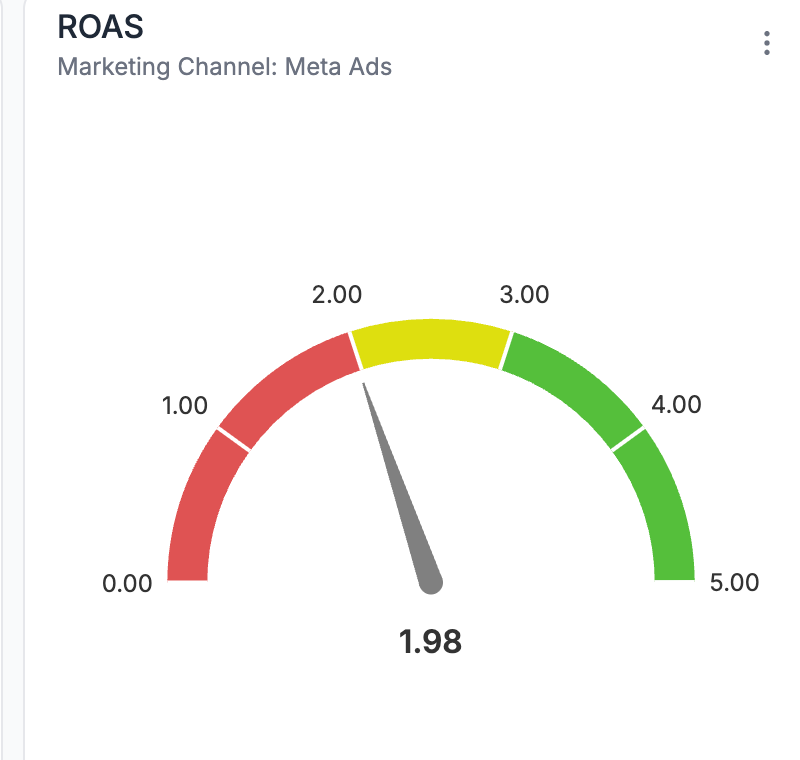
Progress indicator
Conversion analysis
Section heading
Choose Your Charts
Transform raw data into visuals that make insights easier to spot.
You're spending on ads. We'll show you which ones matter.