
We looked at October data from 100 e-commerce brands using ThoughtMetric to understand how different marketing channels perform for new and returning customers.
Which Channels Drive New Customers

Returning Customer Revenue Share % by Channel
Google Ads: 24.8%
Meta Ads: 16.8%
Direct Traffic: 13%
Organic Search: 8.9%
Email: 6.5%
Other: 8.6%
Referrals: 4.1%
Bing Ads: 3.1%
Organic Social: 2.1%
SMS: 0.7%
Affiliate: 1.70%
Word of Mouth: 1.4%
Pinterest Ads: 0.5%
ChatGPT: 0.3%
Influencers: 0.3%
TikTok Ads: 0.3%
YouTube: 0.2%
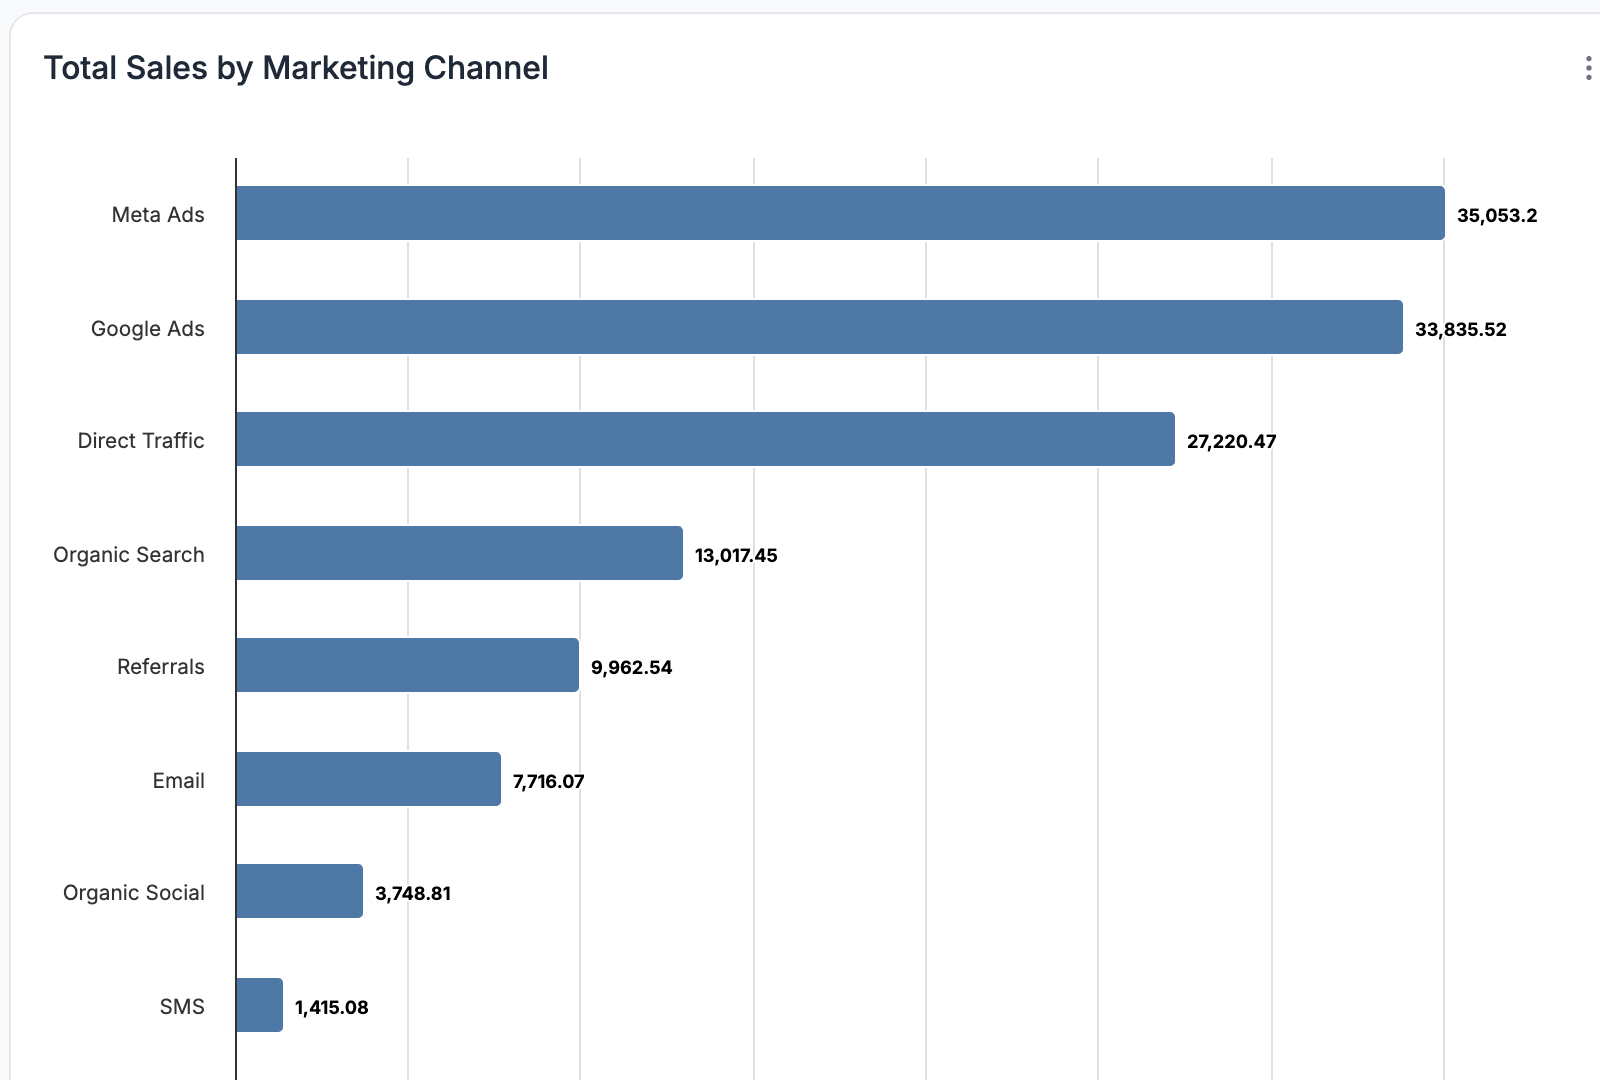
Google Ads came out ahead of all channels for new customer sales, accounting for roughly 25 percent of total new customer revenue. It remains the primary acquisition channel for most brands.
Meta Ads followed at 17 percent, showing that paid social still plays a key role in discovery and awareness.
Organic Search and Direct Traffic also contributed meaningful shares, reflecting the power of strong SEO and brand recognition.
Which Channels Drive Returning Customers

Returning Customer Revenue Share % by Channel
Google Ads: 25.6%
Direct Traffic: 16.8%
Email: 13.1%
Organic Search: 10%
Meta Ads: 8.1%
Other: 10.6%
Referrals: 4%
Bing Ads: 2.2%
Organic Social: 1.1%
SMS: 0.7%
Affiliate: 0.7%
Word of Mouth: 0.4%
Pinterest Ads: 0.3%
ChatGPT: 0.1%
Influencers: 0.1%
TikTok Ads: 0.1%
When it comes to returning customers, Google Ads leads all channels, accounting for about 26 percent of total returning customer revenue. Direct Traffic follows at 17 percent, showing that strong brand awareness and customer familiarity play a big role in retention. Email ranks close behind at 13 percent, reflecting the continued value of lifecycle marketing and post-purchase communication in driving repeat orders.
How to Measure New vs. Returning in ThoughtMetric
To see how your own customers break down, open the Customers tab in ThoughtMetric and click New and Returning. You’ll see total sales and orders for each group.
Why It Matters
Acquisition and retention require different strategies, but both are critical for growth.
Knowing which channels attract new customers helps you scale top-of-funnel efforts efficiently. Understanding which channels bring customers back helps you strengthen loyalty and lifetime value.
When you combine both views in ThoughtMetric, you get a complete picture of how your marketing drives revenue across the customer journey.
Ready to see how your marketing performs across new and returning customers?
FAQs
Can I compare new and returning customer performance by channel in ThoughtMetric?
Yes. ThoughtMetric breaks down new and returning sales by marketing channel, so you can see exactly which sources bring in first-time buyers and which ones drive repeat purchases.
Which attribution models does ThoughtMetric offer?
ThoughtMetric supports five attribution models: First Touch, Last Touch, Multi-Touch, Position-Based, and Linear Paid. You can toggle between models to see how each one impacts your view of customer acquisition and retention.
Can I use ThoughtMetric to track customer lifetime value (LTV)?
Yes. ThoughtMetric includes LTV insights to help you understand the long-term value of your customers and how different channels influence it over time.