
The new Product Attribution Dashboard in ThoughtMetric is here, and it’s built to answer one of the most important questions for e-commerce marketers:
Which products are really driving your growth, and through which channels?
Whether you're launching new SKUs or scaling evergreen products, this dashboard gives you the clarity to invest where it counts. Let’s walk through how it works and why it matters.
What You Can Do with the Product Attribution Dashboard
This update lets you:
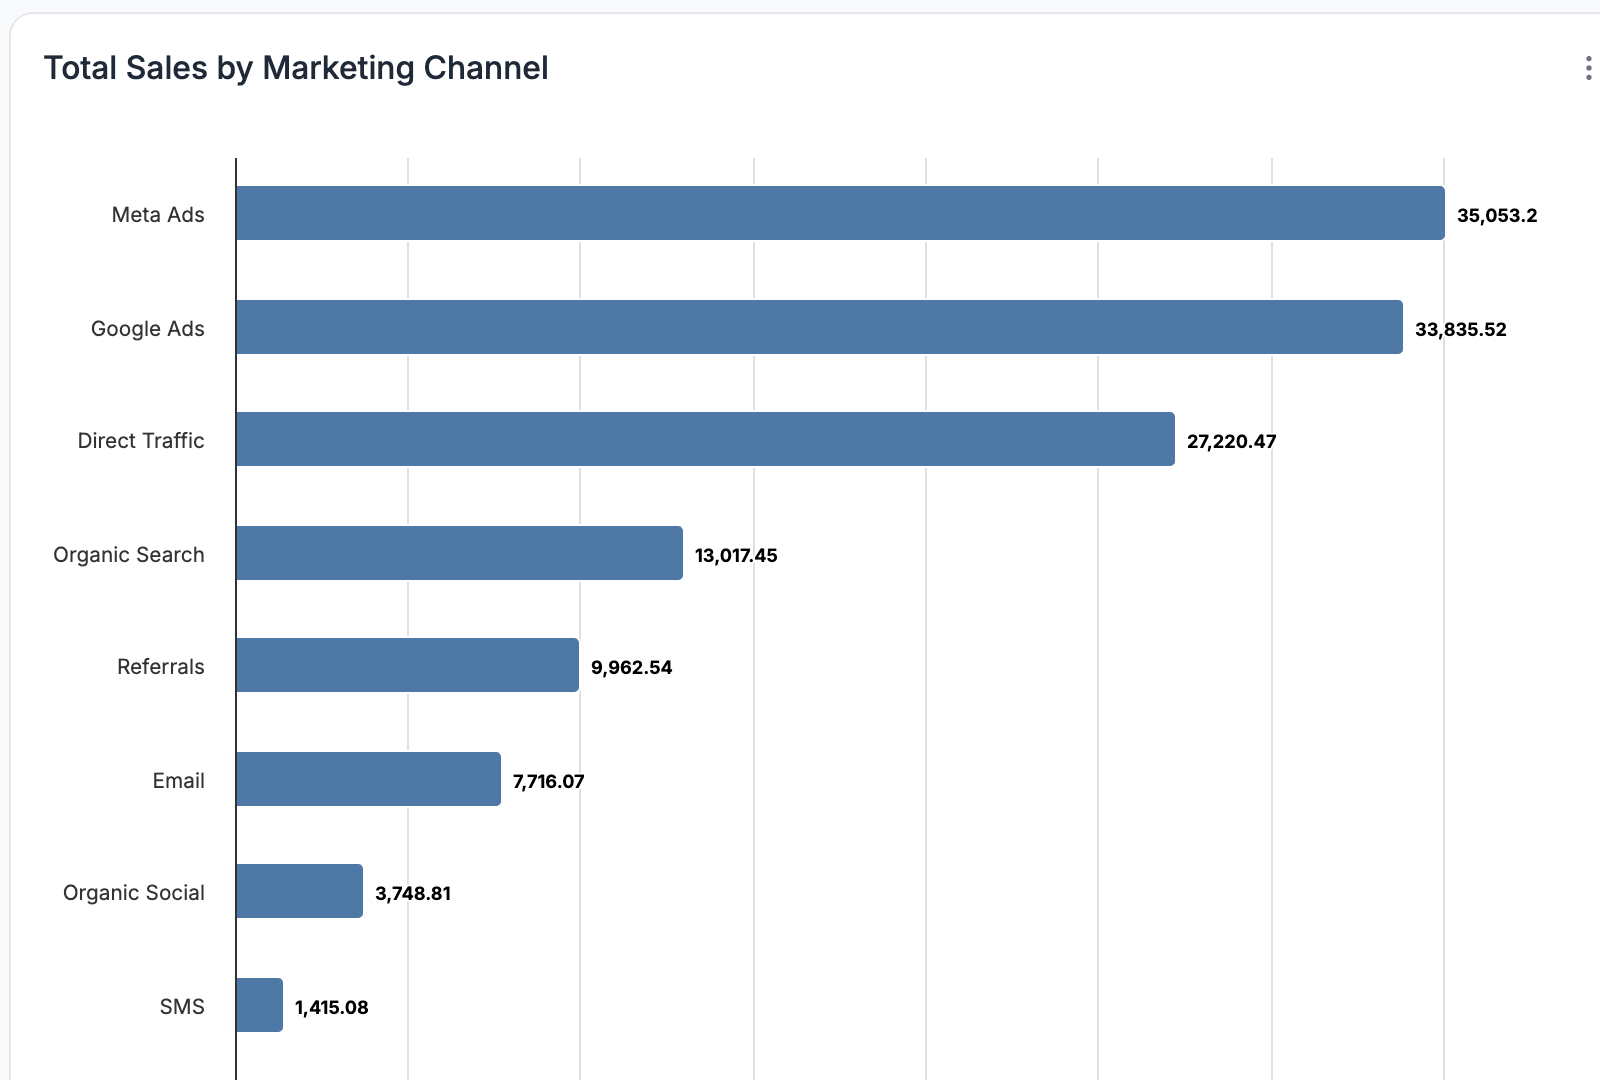
- Track product-level sales across marketing channels
- Compare performance between new and returning customers
- Understand which products convert best and through what source
- Monitor trends over time for each SKU
These insights help you double down on what’s working and make faster decisions on product strategy, merchandising, and campaign targeting.
Navigating the Dashboard
To get started, go to Product in the left-hand menu, then click Product Attribution.
Here’s what you’ll see:
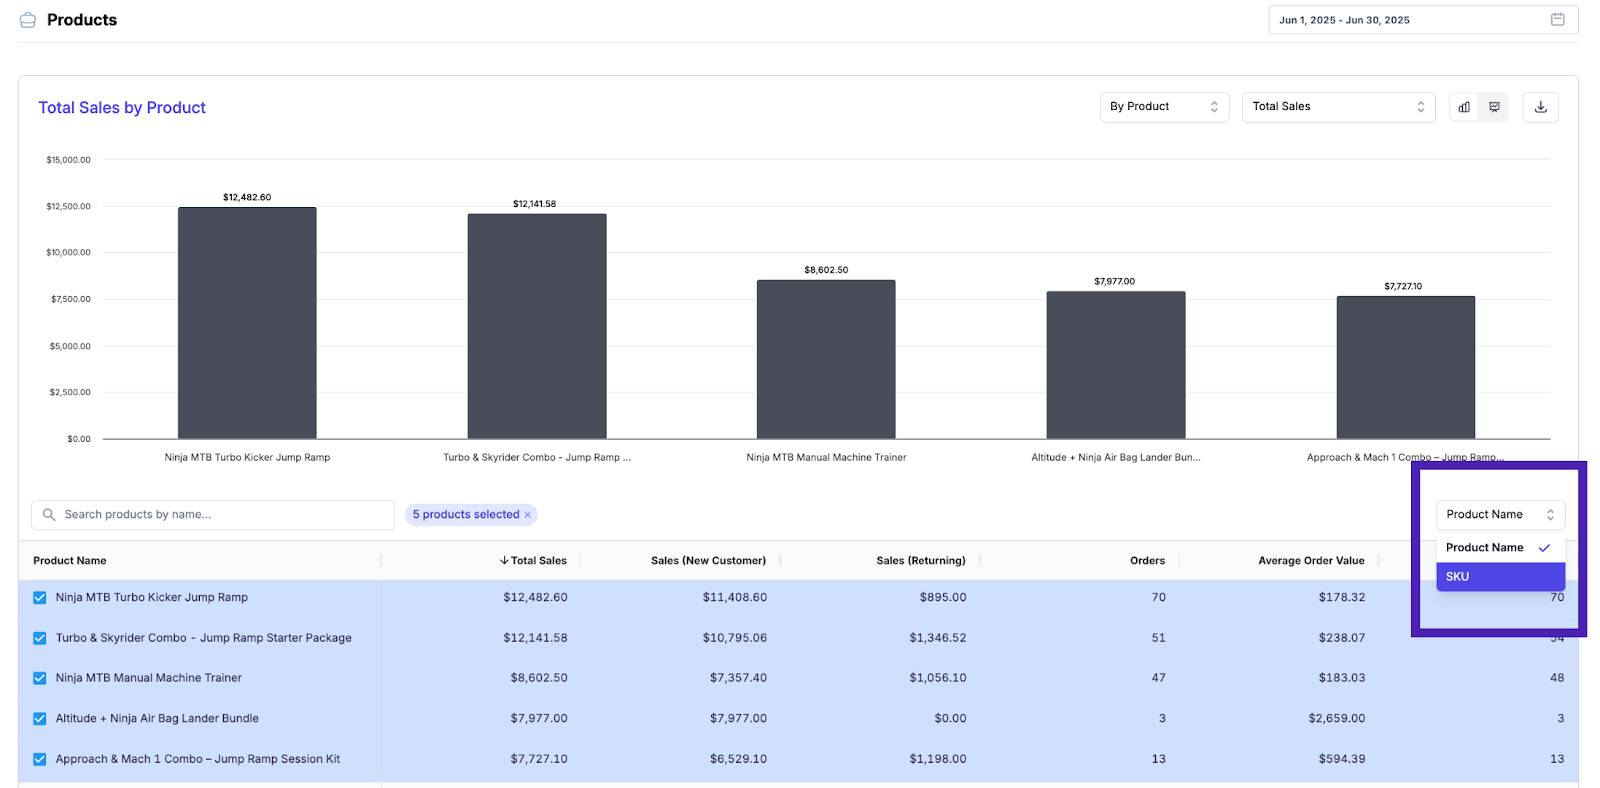
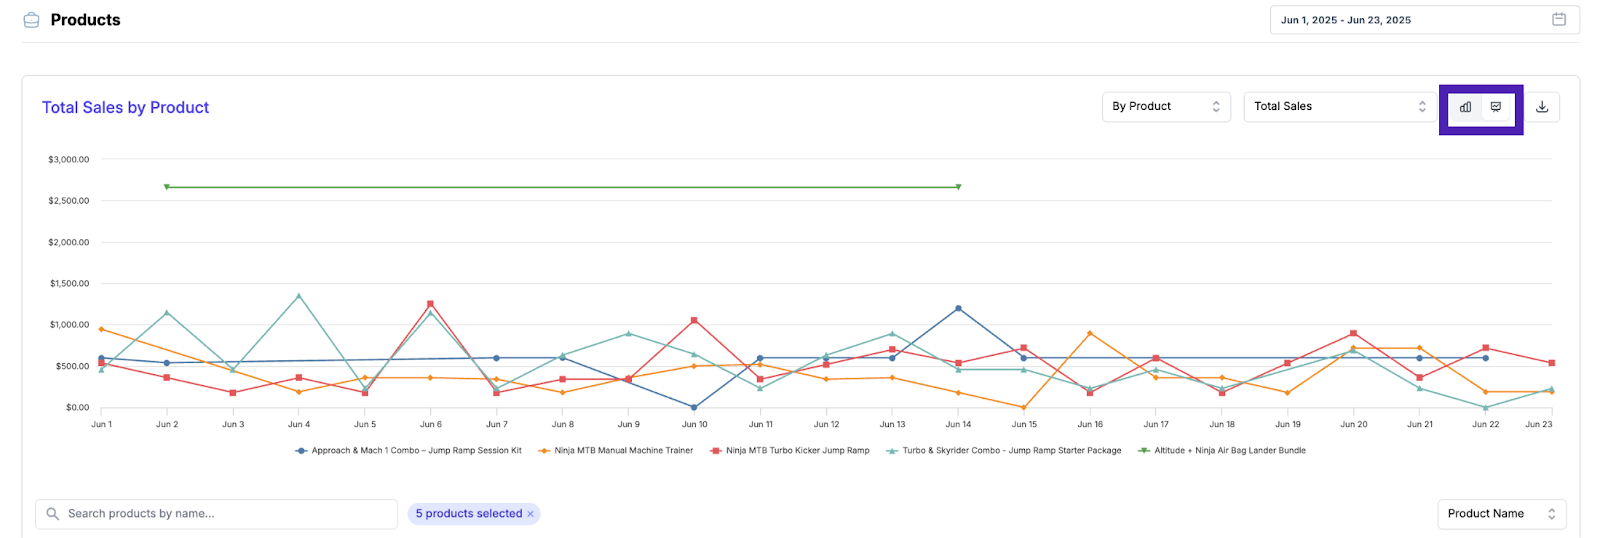
Total Sales by Product
By default, you’ll see a chart of your top five products by total sales. You can:
- Add or remove products using the selection panel
- Use the search bar to find specific items (great for large catalogs)
- Sort any column including:
- Total Sales
- Sales by New Customer
- Sales by Returning Customer
- Orders
- Average Order Value (AOV)
- Items Sold
- Total Sales
View by SKU
Prefer to analyze performance by SKU instead of product name? Just toggle the display from “Product name” to “SKU.”
Time-Based Trends
Click the line chart icon in the top right to see how any metric changes over time. This is especially helpful for tracking seasonal surges, product launches, or shifts after a campaign push.
The Game-Changer: Product Performance by Channel
Now for the best part.
You can break down product performance by channel. After selecting the products you want to analyze, choose "By Channel" from the dropdown in the upper right corner.
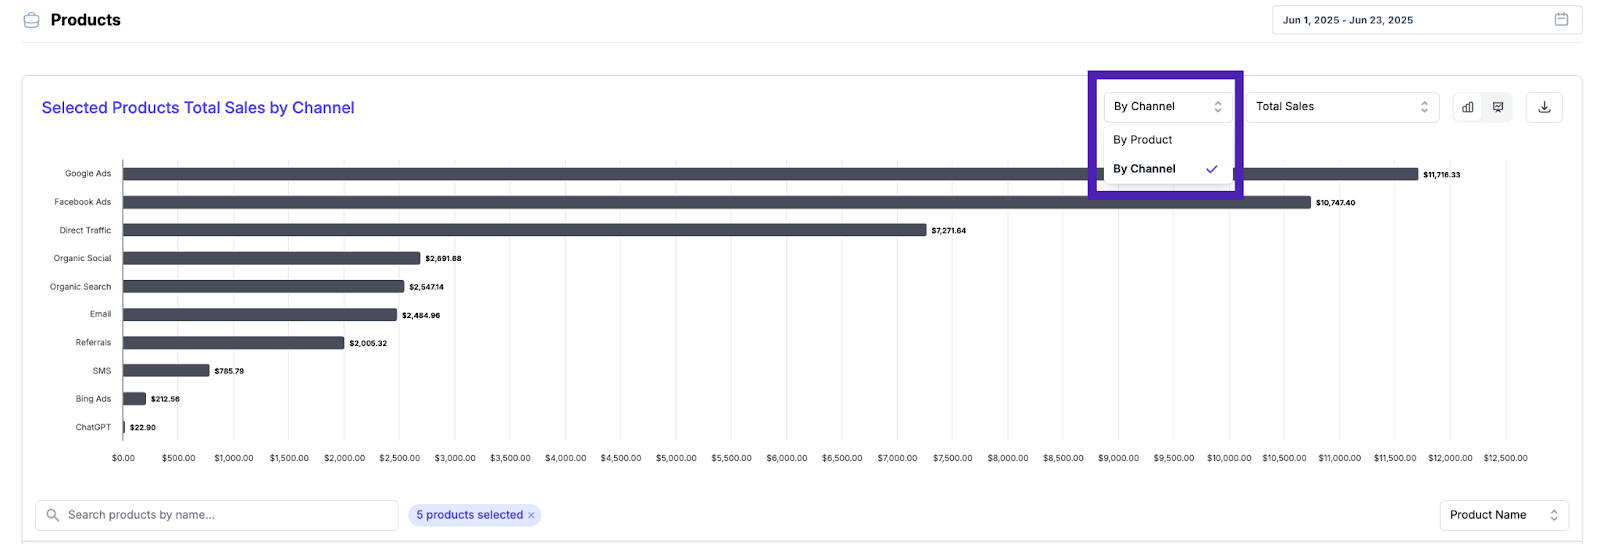
From there, you’ll see:
-
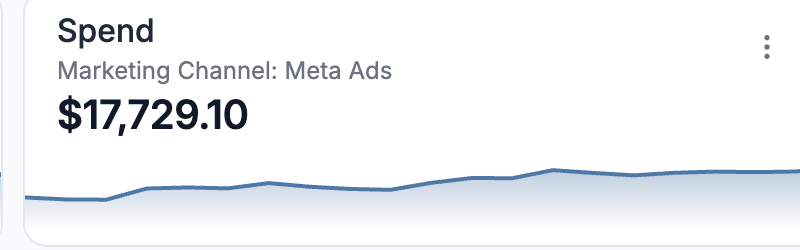
Total Sales by Channel for each product
-
Sales by New Customer across different channels
-
Sales by Returning Customer, so you can see which channels drive loyalty
For example, you might find that:
- One channel drives the most new customer sales
- Another channel generates more repeat purchases
These insights help you fine-tune your campaigns, segment audiences, and optimize product-channel fit.
Want a Personalized Walkthrough?
We’d love to show you how this can work for your store. Book a demo here.
FAQ:
Q: What is the Product Attribution Dashboard in ThoughtMetric?
A: It’s a new feature that lets you view sales, customer types, and performance trends for individual products across different marketing channels.
A: It’s a new feature that lets you view sales, customer types, and performance trends for individual products across different marketing channels.
Q: Can I track returning vs. new customer sales by product?
A: Yes. You can break down sales data for each product by new and returning customers, helping you understand product-level loyalty.
Q: Which channels can I analyze?
A: Any connected channel in your ThoughtMetric account—including Google Ads, Facebook, Instagram, email, affiliate, and more.
Q: Can I sort or search by product name or SKU?
A: Absolutely. You can search specific products and toggle between product name and SKU views for deeper insights.