
This is one of the most exciting ThoughtMetric updates to date because it gives teams full control over how their data is organized.
Today, we’re introducing Custom Reports, a new way to build dashboards that reflect how your team actually thinks about performance. Instead of working around fixed layouts or default views, you can now create reports that highlight what matters most, filter out what doesn’t. Everyone sees the data that is most relevant to their role.
At its core, this update is about focus, flexibility, and ease of use.
See the Metrics That Actually Matter
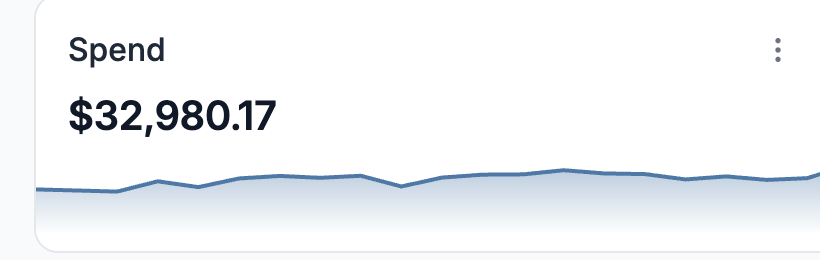
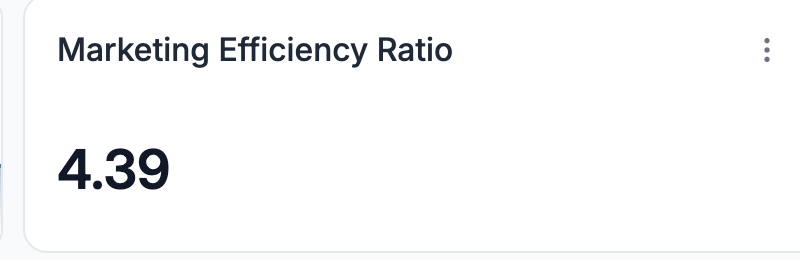
Every team has a handful of metrics that drive decisions. Revenue, CAC, conversion rate, MER, new versus returning customers. The Custom Reports feature lets you pull your most important performance indicators to the front.

Views for Every Role on Your Team
Founders, marketers, analysts, and operators all look at data differently. A single dashboard rarely works for everyone.
With individual reports, each team member gets to build their own dashboard.
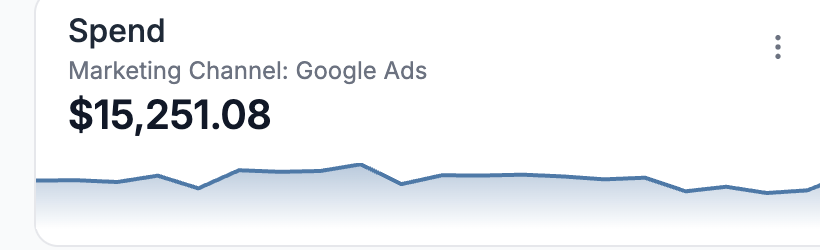
Marketers can focus on channel and campaign performance. Founders can see high-level revenue and efficiency metrics. Analysts can dive deeper into trends and comparisons. Each view is tailored to what that person needs to do their job.

Total Widget Flexibility
The Custom Reports feature gives you full control over how your dashboards look and function.
You can move, resize, and arrange widgets effortlessly using simple drag-and-drop tools. Adjust spacing. Fine-tune sizing. Create a layout that mirrors how you think about performance.
Whether you prefer a clean, minimal overview or a more detailed analytical view, the dashboard adapts to you, not the other way around.

Choose Your Charts
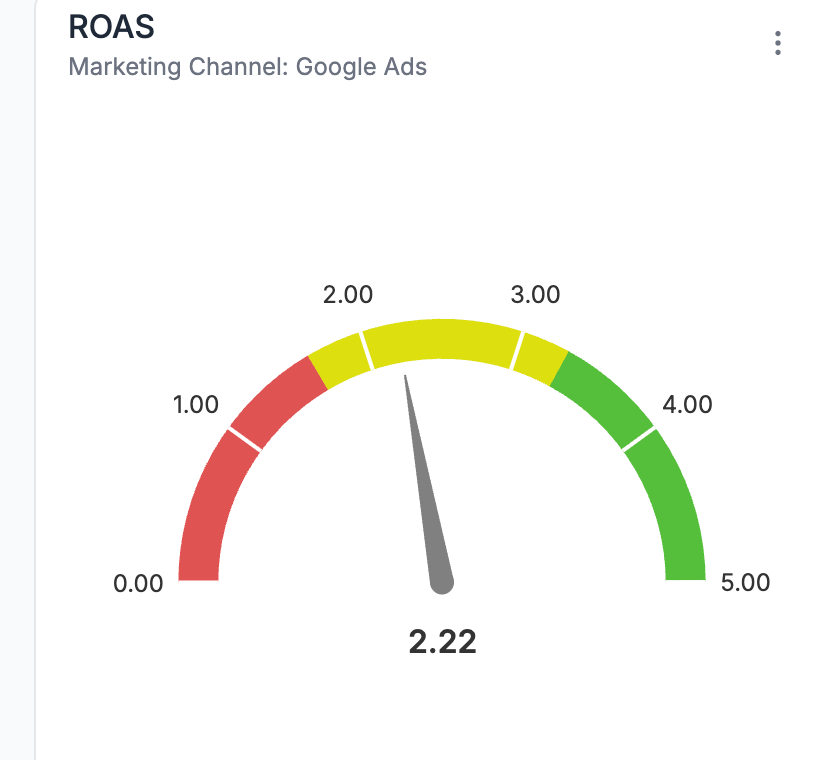
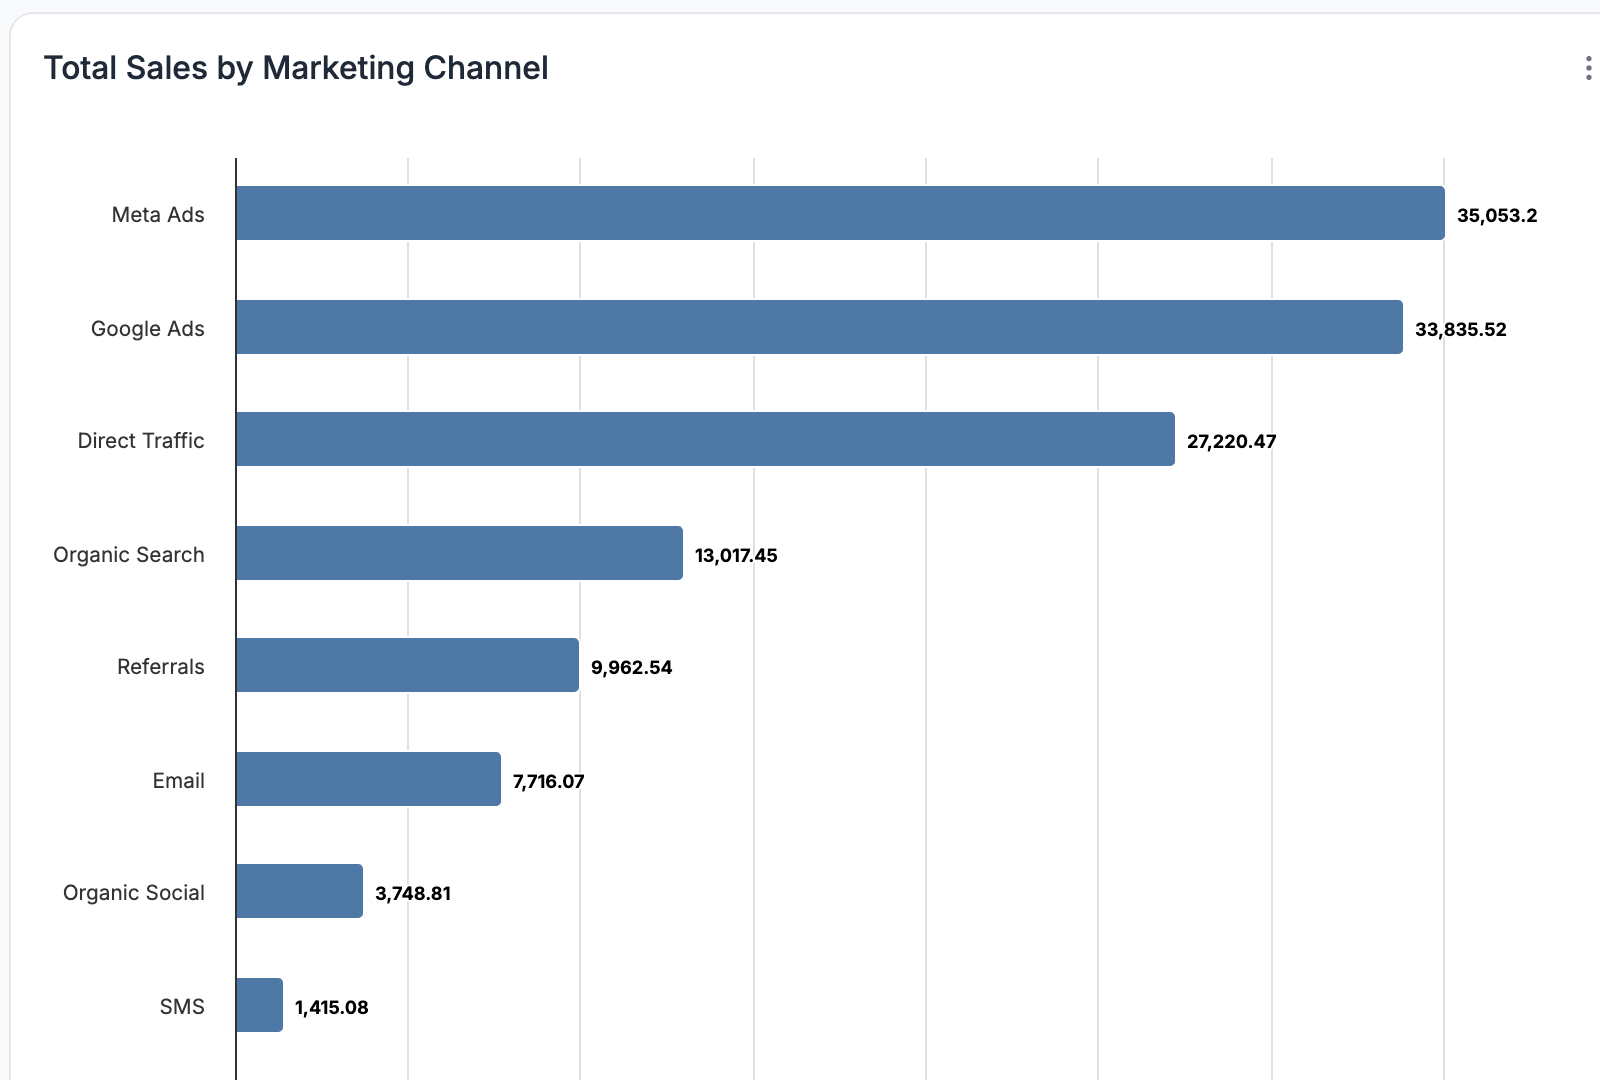
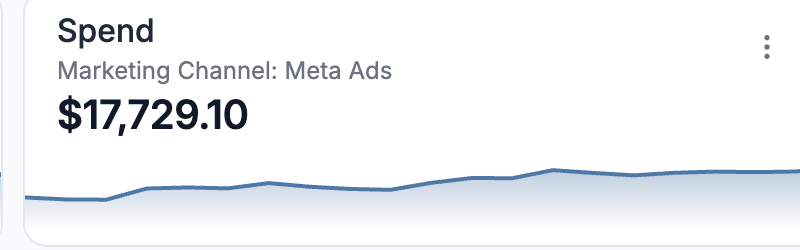
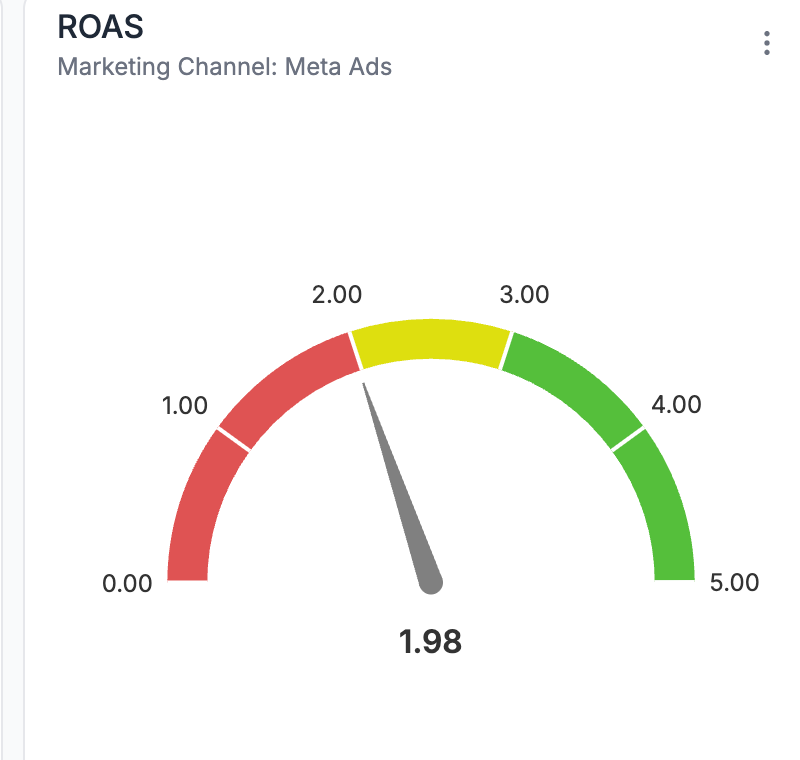
You can choose from ten different chart/visual types so you can see your data in the way that makes the most sense. Bar charts, line charts, tables, and more. No manual chart building in Excel or Google Sheets.

How to Create a Custom Report in ThoughtMetric
Try It In ThoughtMetric
Go try it out now by heading over to the left-side navigation bar and clicking Custom Reports. Feel free to take a screenshot of the reports you create and tag us on LinkedIn. First 5 participants will receive a $10 Amazon gift card.