Looking at week over week revenue share across e-commerce marketing channels provides a useful snapshot of how customer behavior shifts.
The data below compares revenue share from March 2–8 to March 9–15.

What This Week’s Data Suggests
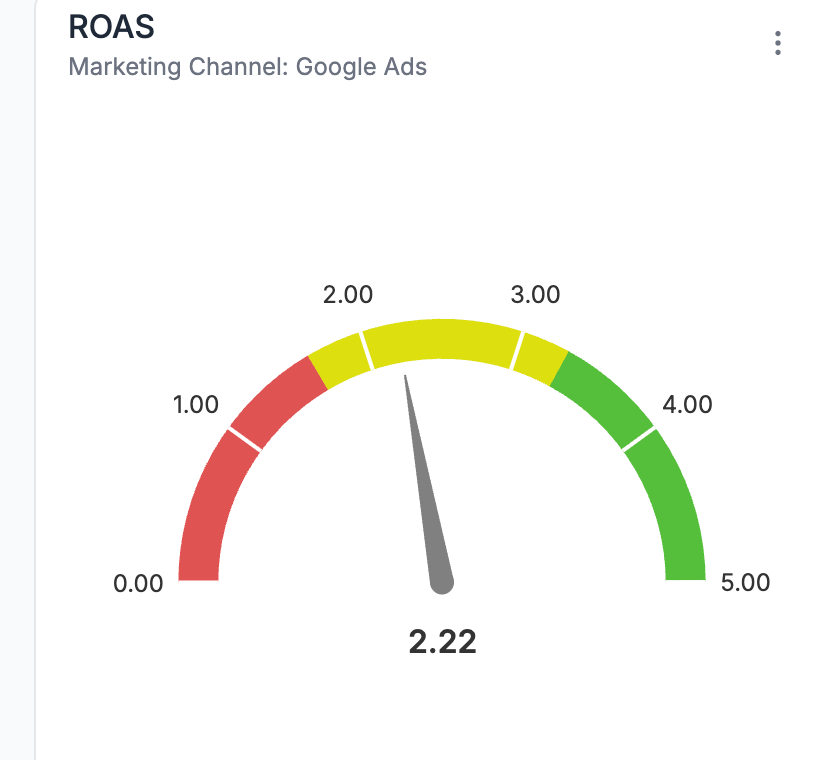
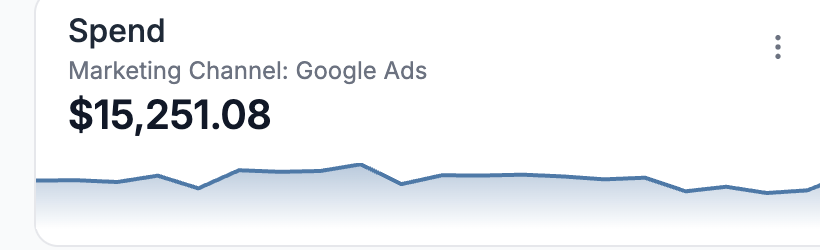
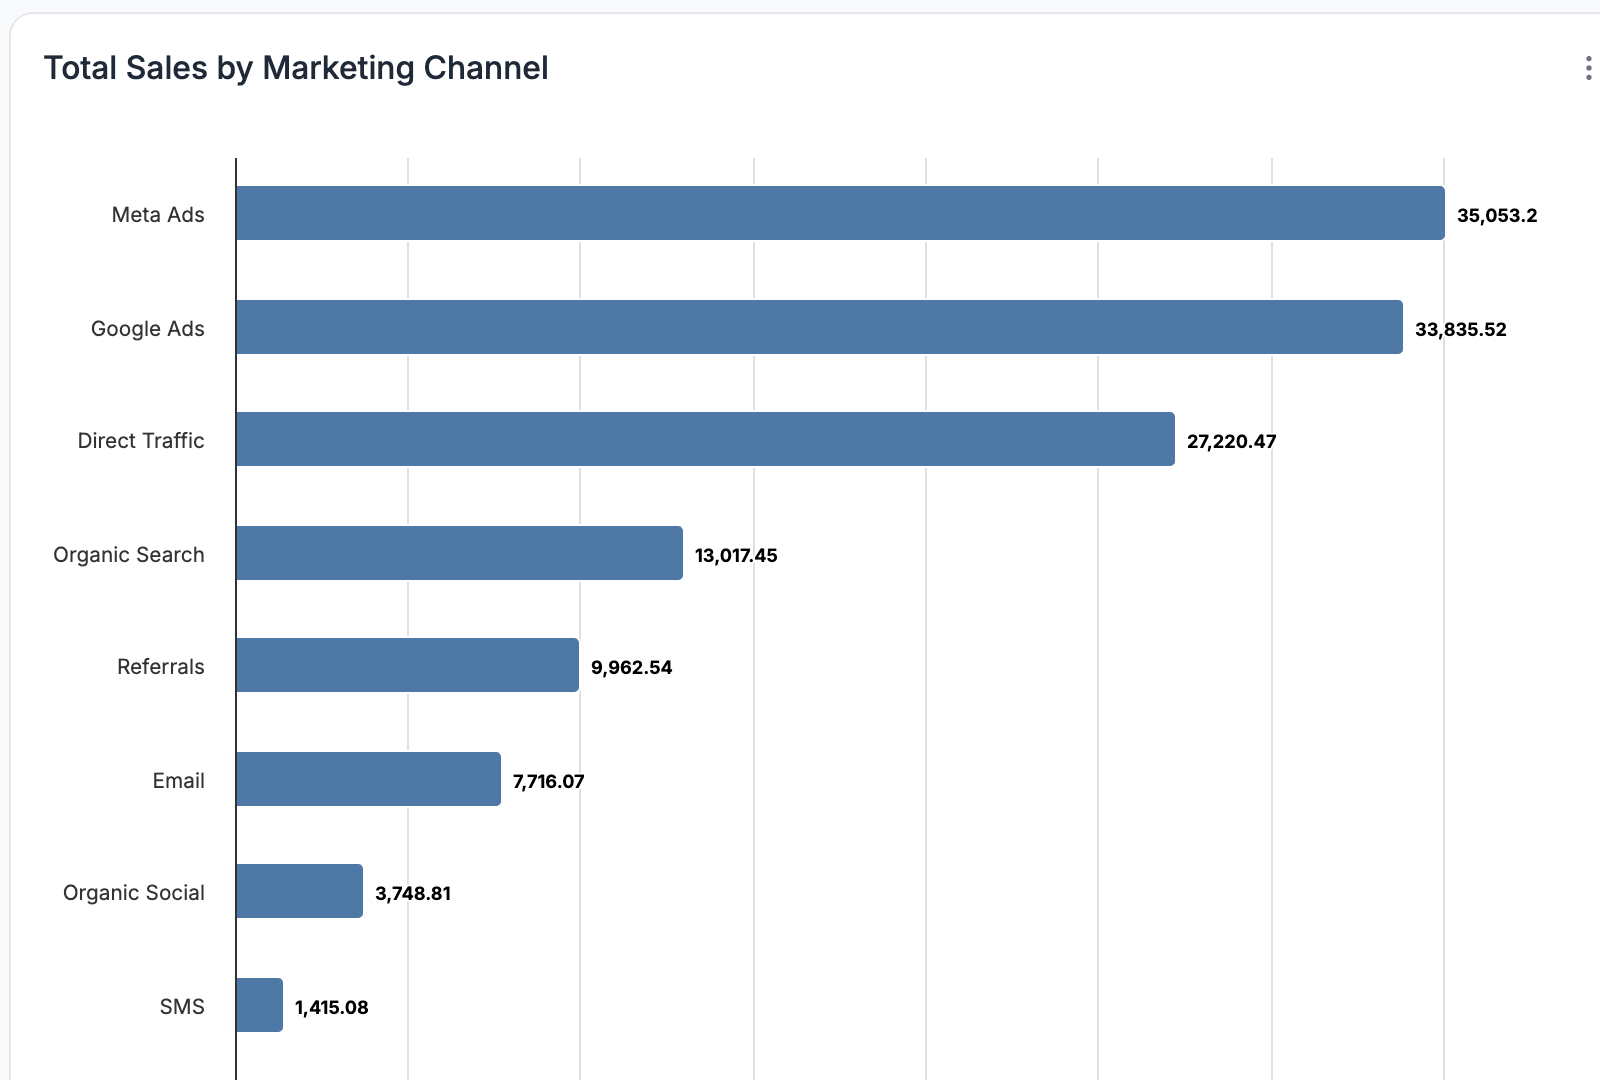
Overall, the marketing channel mix remained relatively stable week over week. The largest contributors such as Google Ads, Direct traffic, Organic Search, and Meta Ads continue to dominate revenue share.
However, smaller channels such as SMS and AI Search showed the most movement. These shifts highlight where new growth opportunities can appear.
For marketers, week over week benchmarks like these provide useful context for evaluating performance changes. Understanding how revenue share shifts across channels helps teams make more informed decisions about where to allocate marketing budget and effort.
Measure Your Own Channel Mix
Benchmarks are useful, but every brand’s channel mix is different. What matters most is understanding which channels are actually driving revenue for your business.
ThoughtMetric helps e-commerce brands measure performance across channels with multi-touch attribution, giving you a clear view of how each touchpoint contributes to revenue.
Book a demo to see how ThoughtMetric can help you measure your own marketing data.