"We looked at a number of competitors in the space, but ultimately chose ThoughtMetric because of its easy-to-understand interface and the support offered during and after implementation."
"With ThoughtMetric, we were able to refine our analytics and provide verifiable proof of the revenue we were driving in a previously underperforming area of the business."
Unlocking Data for Everyone: Why Simplicity Matters in Analytics
Alex Fusco
June 05, 2025
Last Updated:
When you’re surrounded by charts, graphs, and endless spreadsheets, it can feel overwhelming. Data can seem like a maze that only the most experienced analysts can navigate. But what if data-driven decision-making didn’t have to be complicated?
Marius T., a ThoughtMetric user, sums it up perfectly:
“The ThoughtMetric dashboard is designed in a way that simplifies interpretation of complex data for any user. It does not matter whether you’re an experienced analyst or someone just beginning their journey in data-driven decision making; this platform graciously meets you at your level.”
This idea gets to the heart of what makes ThoughtMetric unique. Instead of creating barriers to understanding, the platform breaks down even the most complex metrics into insights that are easy to grasp and act on.
Clear Insights, No Matter Your Experience
What sets ThoughtMetric apart is its ability to meet you wherever you are on your data journey. If you’re just getting started, the platform’s intuitive visuals and clear summaries help you see what matters most without getting lost in the noise. And if you’re a veteran analyst, ThoughtMetric provides the depth and flexibility you need to dig deeper and find the story behind the numbers.
Data Clarity that Powers Better Results
Marius’s experience speaks to a bigger truth: data is only valuable if you can do something with it. ThoughtMetric empowers users at every level to not just look at data, but to use it. To make smarter decisions. To iterate on what’s working. And to stop wasting time on what’s not.
When data is accessible and actionable, it’s no longer just a report. It’s a roadmap to growth.
Q: What sets ThoughtMetric apart from other analytics platforms? A: ThoughtMetric makes data easy to understand and act on for any user, whether you are new to analytics or have years of experience.
Q: How does ThoughtMetric help people who are new to data-driven decision-making? A: ThoughtMetric provides intuitive visuals and simple summaries that guide beginners through complex data without overwhelming them.
Q: Why does simplicity matter in data analytics? A: Simplicity ensures that data is not just another report. It becomes an actionable tool for smarter decisions and real growth.
Q: Does ThoughtMetric offer flexibility for experienced analysts? A: Yes, ThoughtMetric gives experienced users the depth and flexibility they need to explore data in detail and find insights that drive results.
Q: How does ThoughtMetric turn data into action? A: By making metrics clear and accessible, ThoughtMetric helps you see what is working, fix what is not, and keep improving.
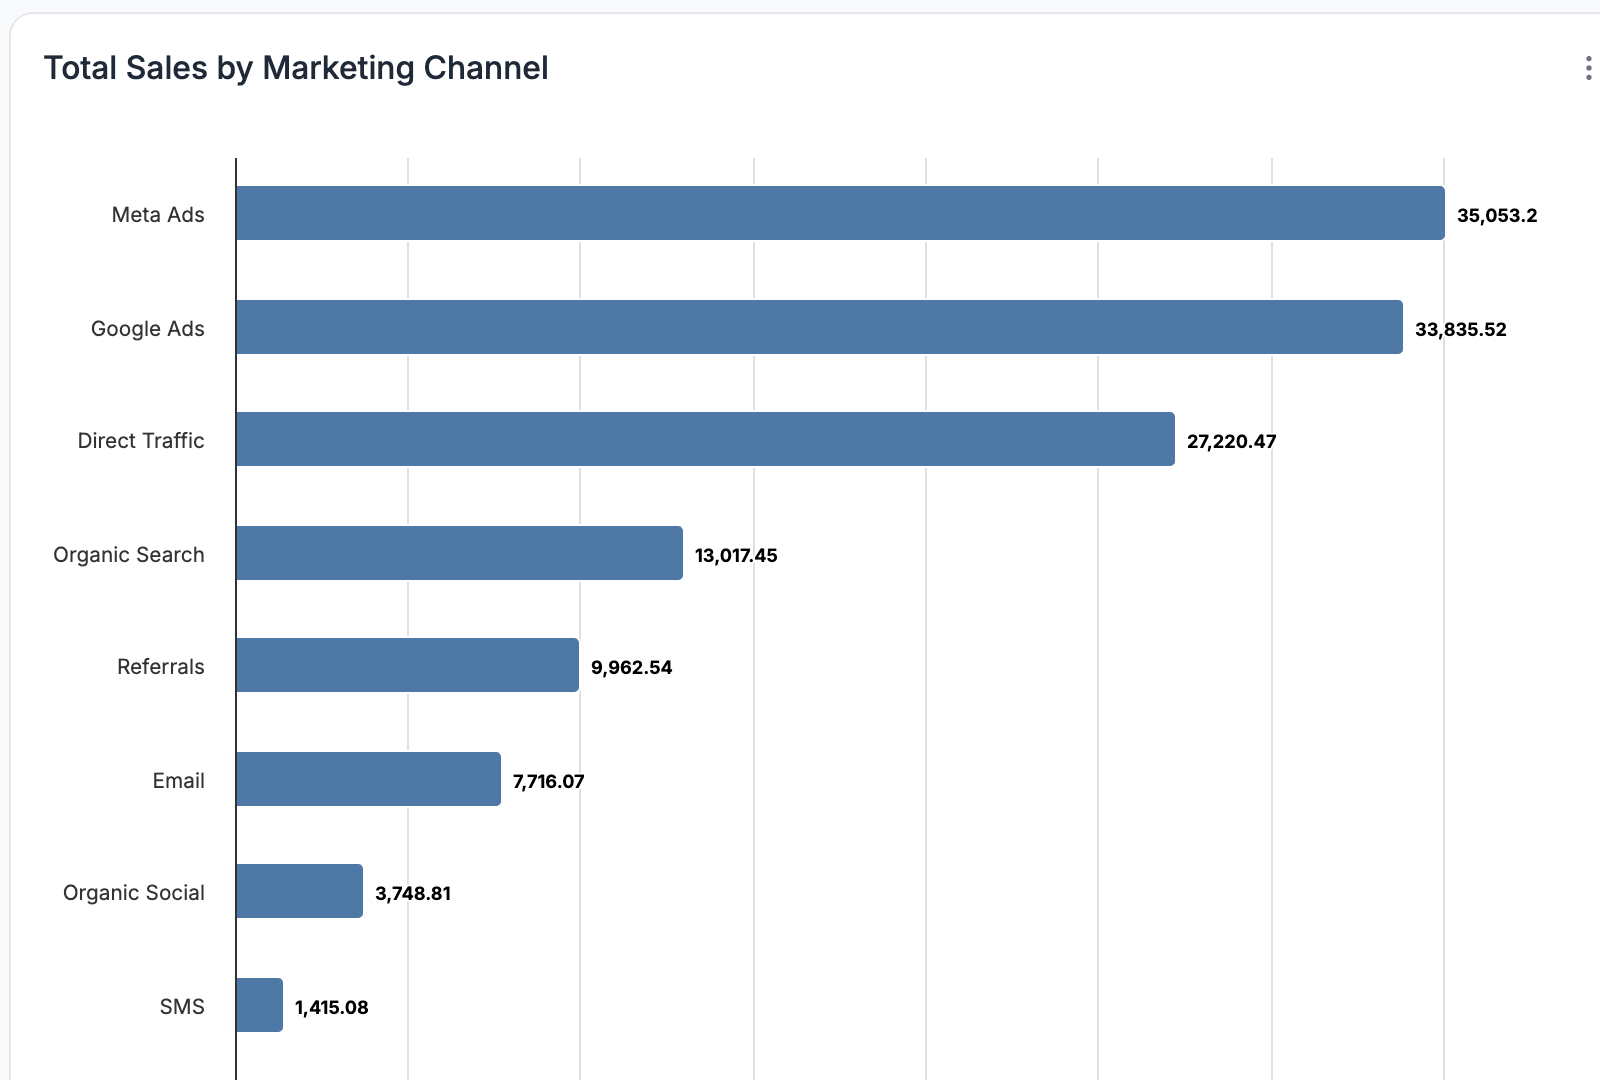
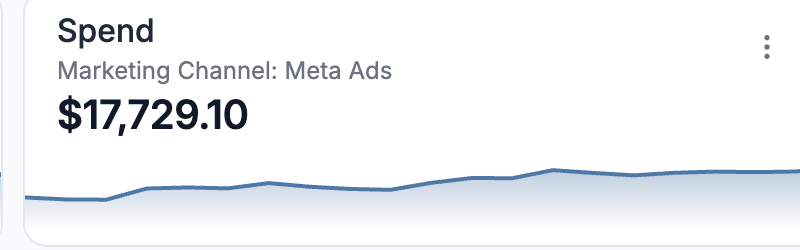
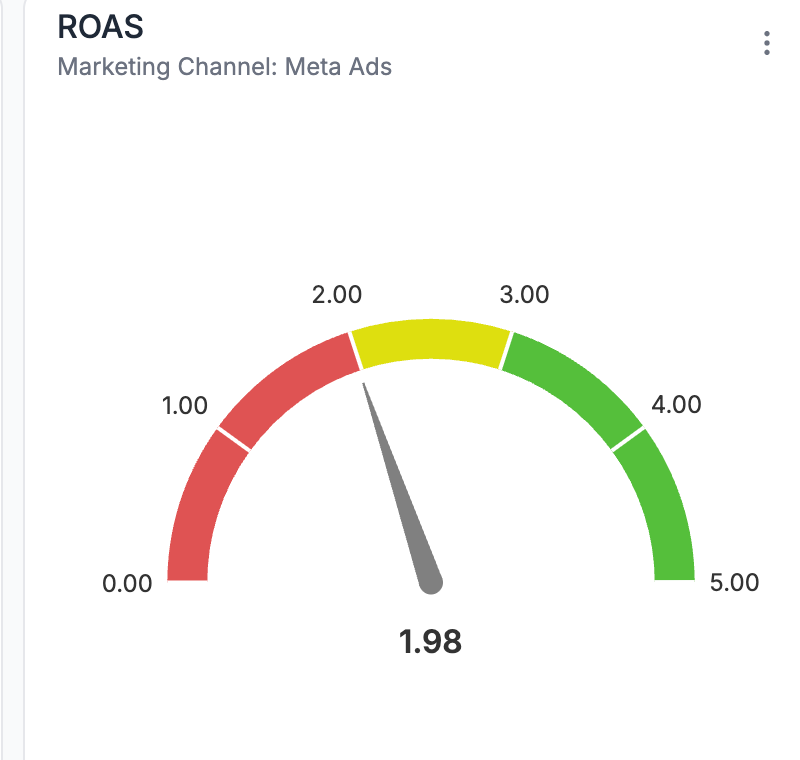
Get full visibility into what drives your revenue.
You're spending on ads. We'll show you which ones matter.