

Custom Reports in ThoughtMetric are designed for one simple goal: make performance immediately understandable. A common question teams ask is how revenue and order volume break down by geography. With Custom Reports, you can answer that in a few clicks!
Below is a step-by-step guide to building a widget that shows total sales and orders by country using the Custom Reports feature in ThoughtMetric.
Step-by-Step: Create a Sales and Orders by Country Widget
Start inside Custom Reports in ThoughtMetric.
1. Add a new widget
Click Add Widget to begin building a custom visualization.
Click Add Widget to begin building a custom visualization.
2. Choose the visualization type
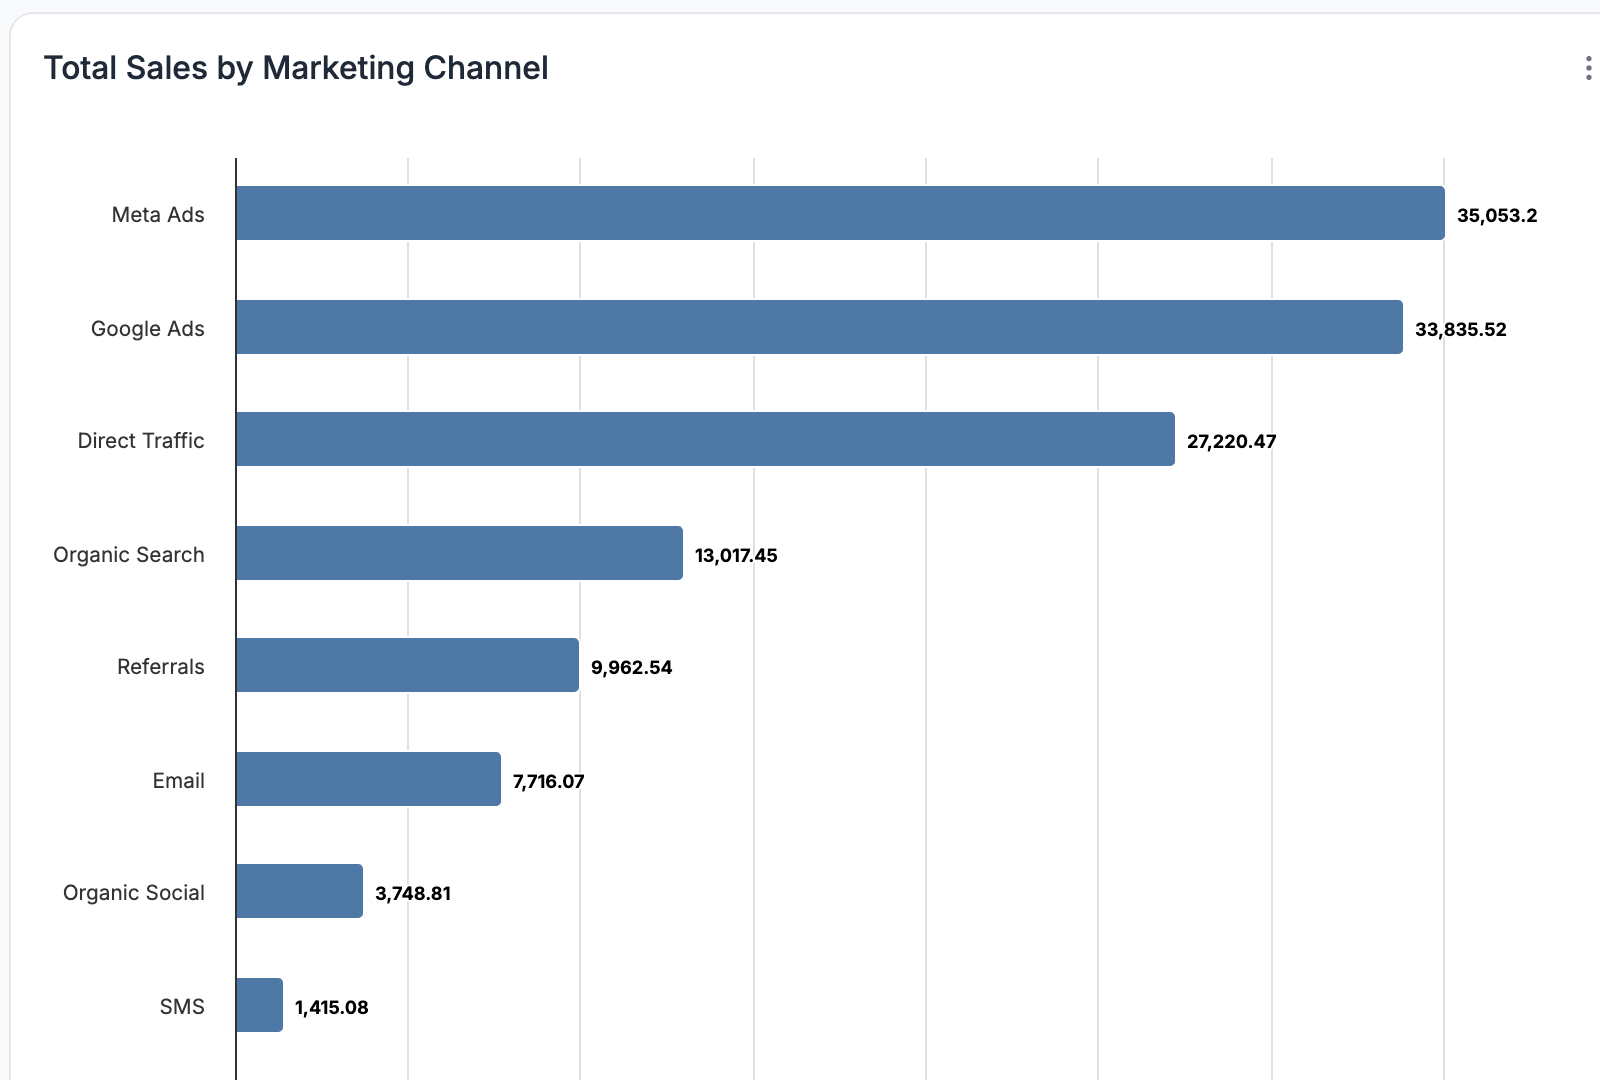
Select Horizontal Bar Chart. This format works well when comparing multiple metrics across categories like countries.
Select Horizontal Bar Chart. This format works well when comparing multiple metrics across categories like countries.
3. Select your metrics
Choose:
- Total Sales
- Orders
These two metrics together show both revenue impact and purchasing behavior.
4. Break down by country
Set the dimension to Country. This tells ThoughtMetric how to group the data.
Set the dimension to Country. This tells ThoughtMetric how to group the data.
5. Limit the results
By default, you may see a long list of countries. To keep the report readable, limit the view to the Top 10 countries by performance.
By default, you may see a long list of countries. To keep the report readable, limit the view to the Top 10 countries by performance.
6. Create and resize the widget
Click Create Widget, then resize it on the report canvas so it fits cleanly alongside your other views.
Click Create Widget, then resize it on the report canvas so it fits cleanly alongside your other views.
7. Save the layout
Save your report layout so it’s always ready to reference or share.
Save your report layout so it’s always ready to reference or share.
Why This Widget Is Useful
This report helps teams quickly answer questions like:
- Where is most of our revenue actually coming from?
- Do high-order regions also drive high revenue?
- Which countries should we prioritize for marketing or localization?
Because it lives inside a Custom Report, it updates automatically and stays consistent with the rest of your attribution data.
What Else You Can Do With Custom Reports
This is just one example of what Custom Reports can handle. There are 11 other custom widgets and 30 pre-made widgets. Each widget is designed to solve a specific reporting question without requiring spreadsheets.

See Custom Reports in Action
If building reports like this would make your reporting faster, book a quick demo to see how teams are using ThoughtMetric.
Frequently Asked Questions
Can I change the number of countries shown?
Yes. You can adjust the limit to show more or fewer countries depending on how detailed you want the report to be.
Yes. You can adjust the limit to show more or fewer countries depending on how detailed you want the report to be.
Can I add more metrics to the same widget?
Yes. Bar charts support multiple metrics, making it easy to compare related performance signals in one view.
Yes. Bar charts support multiple metrics, making it easy to compare related performance signals in one view.

.png)

