
.png)
Slide decks have been the default way agencies and marketing teams report performance to clients for years. They’re familiar, they’re expected, and they’re easy to circulate.
They’re also slow to build, hard to maintain, and sometimes contain a mistake or two from manually reporting (we’ve all been there). Do some of the following struggles sound familiar?
- Logging into multiple platforms like Meta, Google Ads, Shopify, TikTok, and more.
- Manually copying data into spreadsheets and slide decks.
- Creating and formatting PDF reports to appear professional.
Good news, there’s an easier option.
With the ThoughtMetric Custom Reports feature, teams can replace static client report decks with an interactive view of performance that updates automatically and actually reflects how the business is operating.

How ThoughtMetric Custom Dashboards Replace Slide Decks
ThoughtMetric’s Custom Dashboards are designed for reporting without the manual work.
You can:
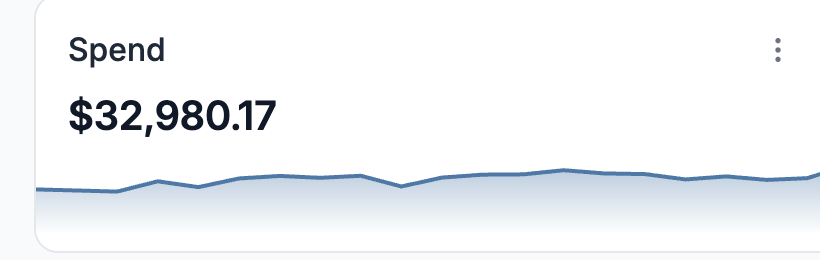
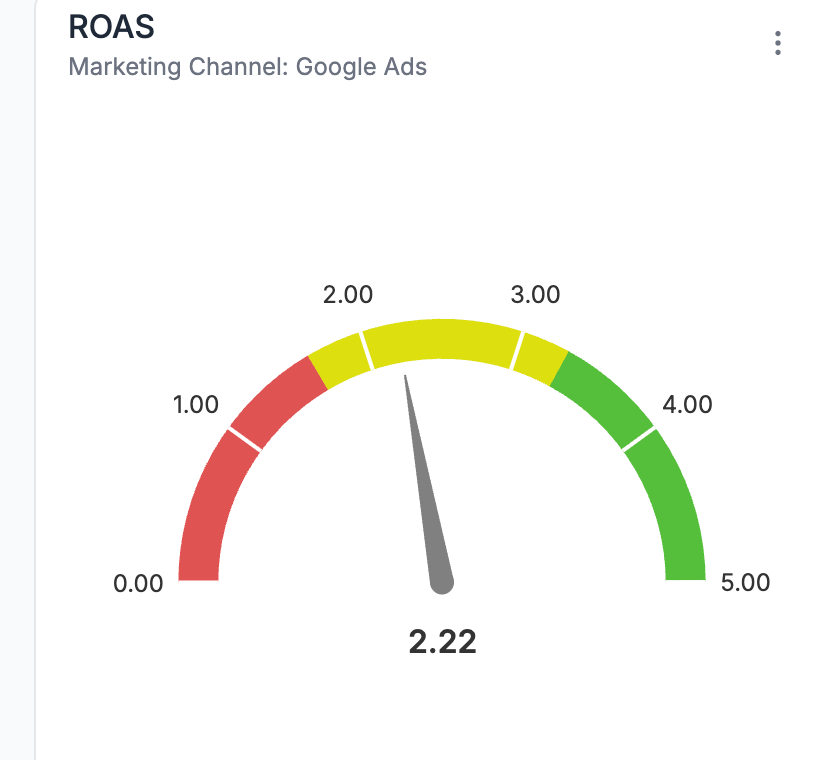
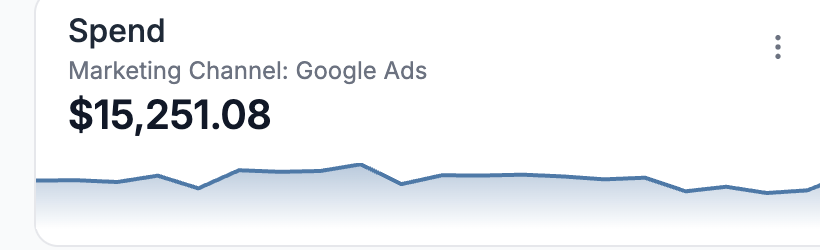
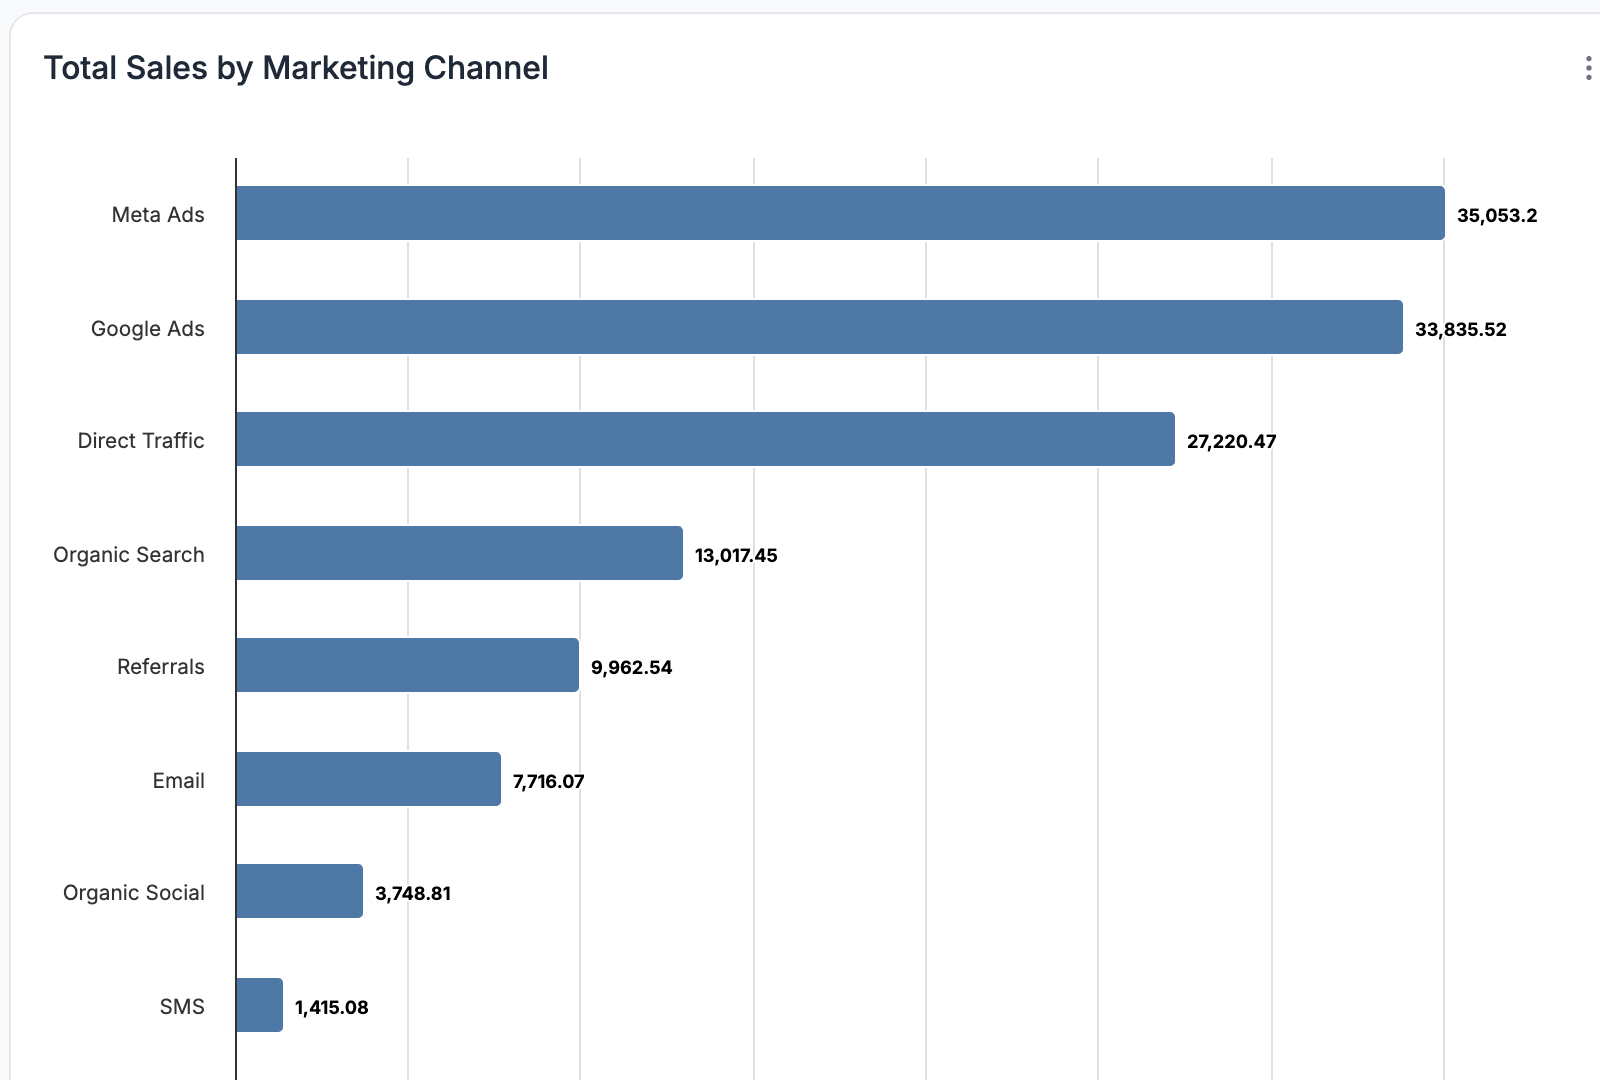
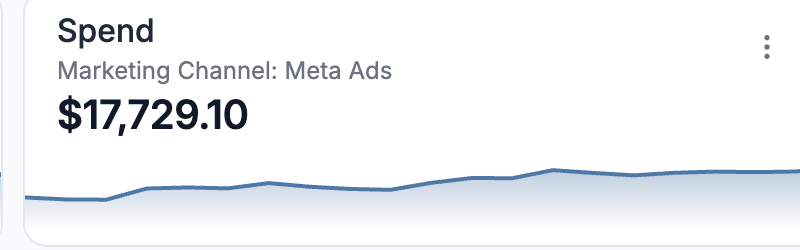
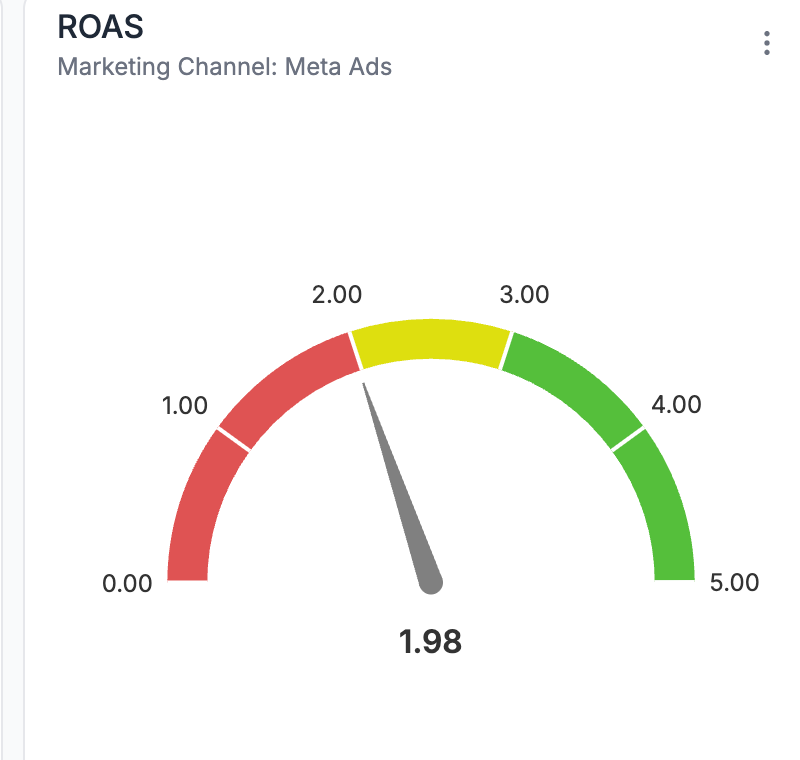
- Create widgets that highlight core KPIs like revenue, ROAS, MER, and conversion rate
- Break metrics down by channel, campaign, product, and more
- Combine multiple visuals into a single, easy-to-navigate layout
- Add or remove widgets as client priorities change.
Each dashboard tells a clear story, but stays flexible enough to answer follow-up questions on the spot. Reporting is less of a recurring task, as the clients can access the reports at any time, in real time. For day-to-day, weekly, and monthly client reporting, ThoughtMetric Custom Reports are faster and clearer.
A Smarter Way to Report
By replacing slide decks with ThoughtMetric Custom Reports, agencies and brands spend less time preparing reports and more time improving performance. Isn’t that the whole point of reporting in the first place?
FAQs
Can clients access ThoughtMetric Custom Reports directly?
Yes. Clients can log in and view dashboards in real time, eliminating the need to send static slide decks or PDFs.
Yes. Clients can log in and view dashboards in real time, eliminating the need to send static slide decks or PDFs.
Do Custom Reports update automatically?
They do. Dashboards refresh every 10 minutes, so metrics are current without manual updates.
They do. Dashboards refresh every 10 minutes, so metrics are current without manual updates.
Can reports be customized per client?
Yes. Each client can have their own dashboard layout, widgets, and metrics based on their specific goals and priorities.
Yes. Each client can have their own dashboard layout, widgets, and metrics based on their specific goals and priorities.
Is ThoughtMetric built for agencies or brands?
Both. Agencies use Custom Reports for client reporting, while brands use them for internal performance tracking and leadership reporting.
Both. Agencies use Custom Reports for client reporting, while brands use them for internal performance tracking and leadership reporting.


.png)