"We looked at a number of competitors in the space, but ultimately chose ThoughtMetric because of its easy-to-understand interface and the support offered during and after implementation."
"With ThoughtMetric, we were able to refine our analytics and provide verifiable proof of the revenue we were driving in a previously underperforming area of the business."
Single-Touch vs. Multi-Touch Orders: What 200 Brands Show Inside ThoughtMetric
Alex Fusco
February 12, 2026
Last Updated:
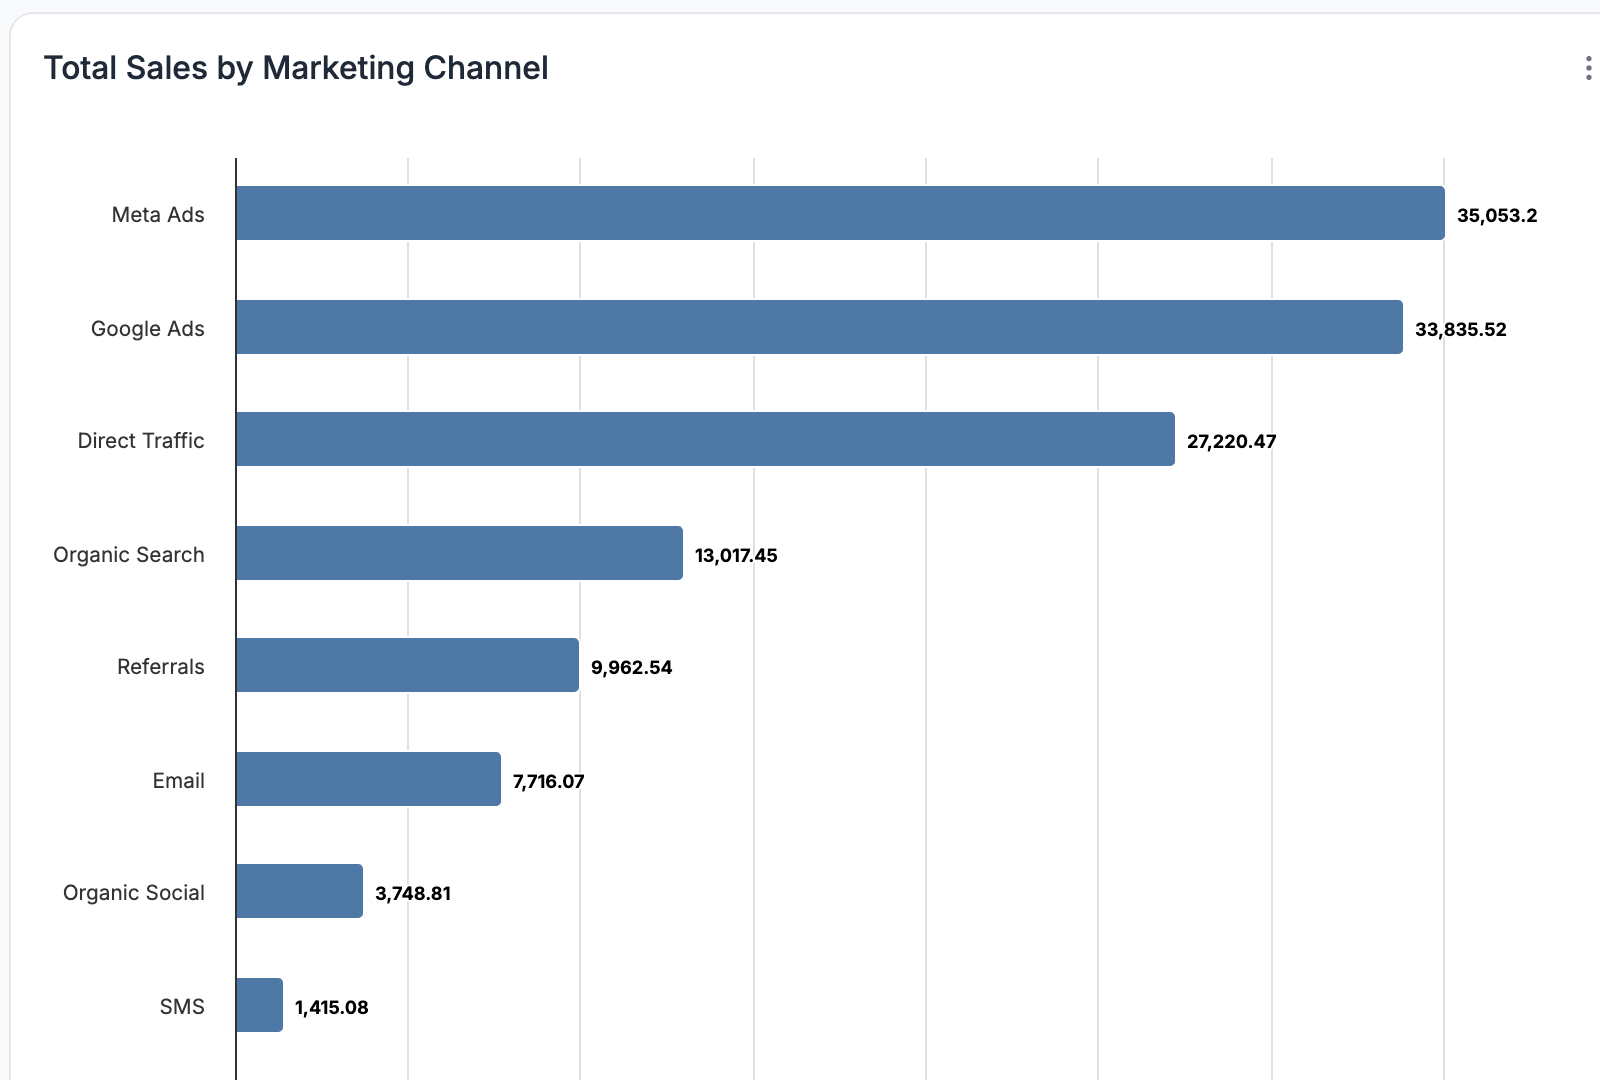
Across 200 e-commerce brands using ThoughtMetric, one insight stands out clearly: 36% of orders are single-touch, while 64% are multi-touch. That means nearly two-thirds of revenue is influenced by more than one interaction before a purchase happens.
If the majority of your customers convert after multiple touchpoints, then attribution needs to reflect that reality.
When 64% of Revenue Is Influenced by Multiple Touchpoints
When 64% of orders are multi-touch, it tells us that customers don’t usually see one ad, click once, and convert immediately. More often, they discover a brand through one channel, search for it later, open an email, browse again, and then finally purchase.
In that environment, assigning 100% of the revenue to a single interaction oversimplifies the process. This is exactly where last-click attribution falls short.
Why Multi-Touch Attribution Matters
ThoughtMetric was built around the fact that most e-commerce revenue is multi-touch. When most orders are multi-touch, attribution must recognize multiple contributors. Multi-touch attribution distributes revenue credit across the customer journey instead of concentrating it at the end.
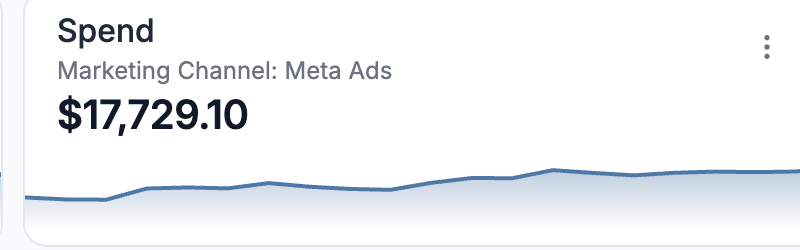
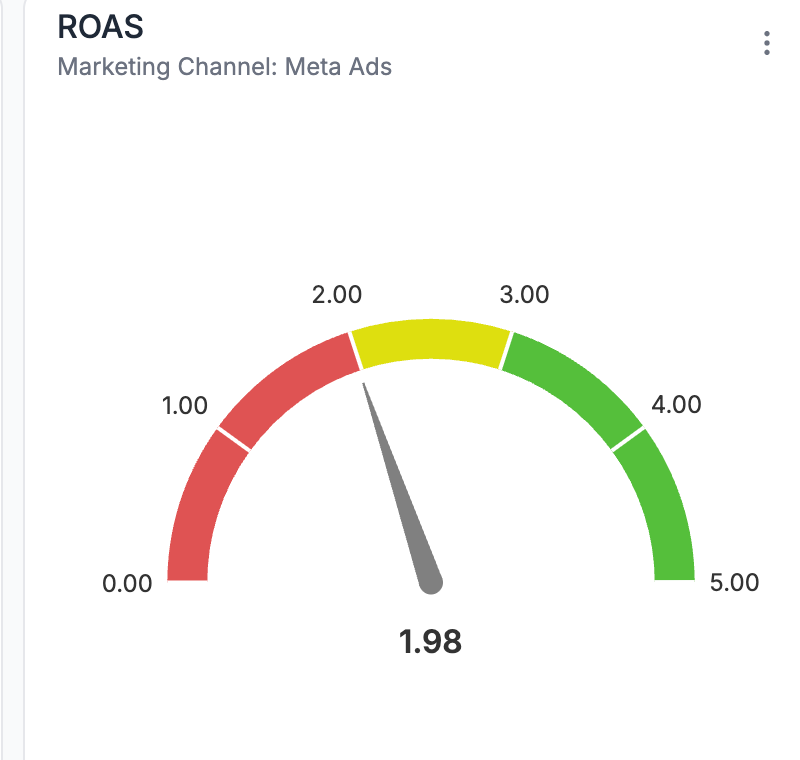
Inside ThoughtMetric, brands can apply multi-touch attribution that reflects how marketing channels work together. Rather than asking which channel “won” the sale, teams can see how channels assist, influence, and support one another throughout the buying process. This creates a more accurate view of contribution.
When you compare single-touch and multi-touch models side by side in ThoughtMetric, revenue often redistributes in meaningful ways. Channels that appear modest under last-click frequently show stronger contribution when the full journey is considered.
How to See If Your Store Is Single-Touch or Multi-Touch Heavy
The 64% vs. 36% split is an aggregate across 200 brands. Your store may look different. The good news is that you can see this directly inside ThoughtMetric.
To analyze your own data go to Customers in the left navigation menu, then select Customer Journey.
In this view, you will see several key data points including:
Average time to order
Average touchpoints to order
Single visit vs. multiple touchpoints breakdown
When you can see the full customer journey, optimization becomes more strategic and budget decisions become easier to defend.
If you want to understand how multi-touch attribution would change the way you evaluate performance, book a ThoughtMetric demo and see how your revenue is actually being generated.
Get full visibility into what drives your revenue.
You're spending on ads. We'll show you which ones matter.


.png)

