"We looked at a number of competitors in the space, but ultimately chose ThoughtMetric because of its easy-to-understand interface and the support offered during and after implementation."
"With ThoughtMetric, we were able to refine our analytics and provide verifiable proof of the revenue we were driving in a previously underperforming area of the business."
How to Read a Multi-Touch Attribution Report in ThoughtMetric
Alex Fusco
April 08, 2026
Last Updated:
Our data shows that e-commerce shoppers convert after an average of 2.9 touchpoints. That means most purchases involve multiple channels, and single-touch attribution models miss the majority of those journeys. Multi-touch models distribute credit across multiple touchpoints that contributed, giving you a much more accurate picture of what's actually driving revenue.
ThoughtMetric offers five attribution models: First Touch, Last Touch, Linear Paid, Position-Based, and Multi-Touch (our recommended model). Let’s walk through how to read that data and use it to make better spend decisions.
Start with the Summary Page
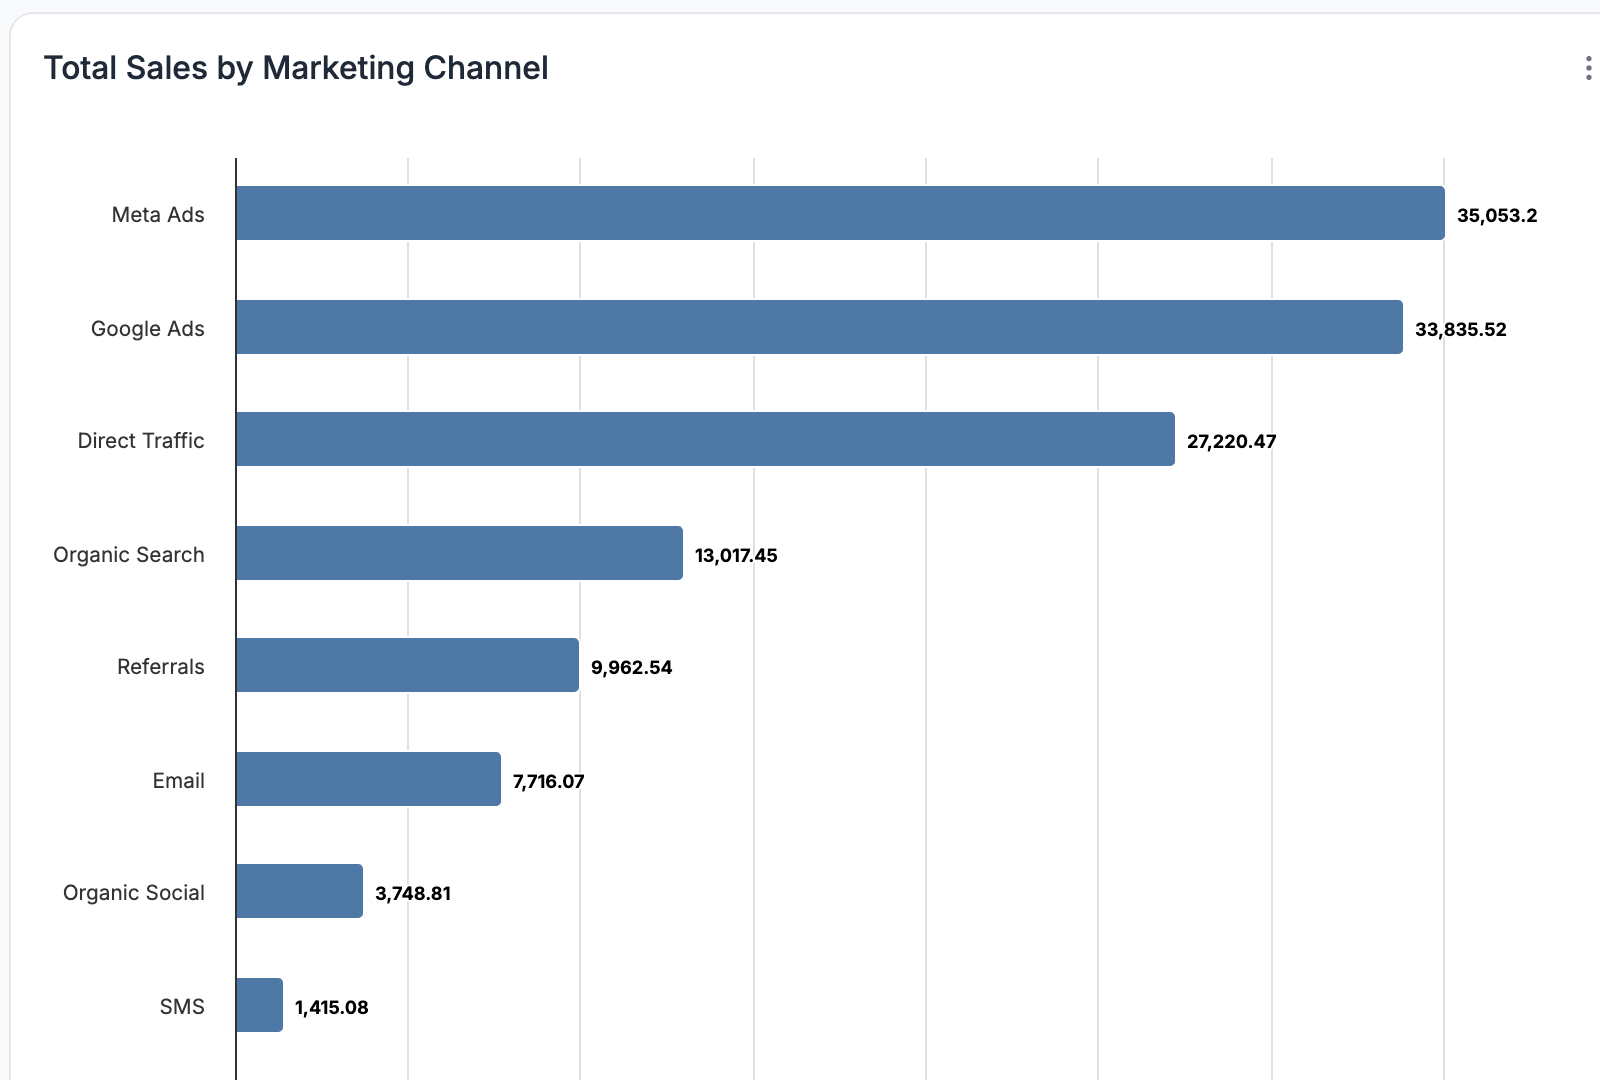
The Summary page in ThoughtMetric shows revenue broken down by marketing channel. This is the first place to look because it gives you a high-level view of where your sales are coming from.
If you're using a multi-touch attribution model, you'll notice something right away. The Orders column will likely show some decimal values. A channel might show 12.4 orders instead of a clean 12. That's because credit for individual orders is being split across channels based on the customer's actual journey.
This is working as intended. If a customer clicked a Meta ad, then came back through a Google ad, and finally purchased after an email, each of those channels gets a share of that order. The decimals tell you that multiple touchpoints contributed.
Read the Order List for Journey Context
Each order in ThoughtMetric shows the channel icons that contributed to that purchase. You'll see paths like Meta Ads, then Google Ads, then Direct, then Purchase. These paths reveal patterns that totals alone can't show.
Look for recurring sequences. If you keep seeing Meta Ads as the first touchpoint followed by Google Ads as the closer, that tells you Meta is doing the prospecting work and Google is catching the demand it creates.
Click into any individual order to see the full breakdown. ThoughtMetric shows a pie chart of how credit was distributed and a timeline of every touchpoint with timestamps. This is where you can see exactly how long the customer journey took and which channels appeared at each stage.
Match Your Lookback Window to Your Buying Cycle
ThoughtMetric lets you set your attribution window to 7, 14, 30, 60, or 90 days. This controls how far back the system looks for touchpoints that contributed to a sale.
The right window depends on how long your customers typically take to buy. A $10 impulse purchase and a $300 product that customers research for weeks have very different conversion timelines, and your attribution window should reflect that.
Wrapping Up
The Summary page gives you the overview. The Orders section gives you the customer-level detail. The lookback window lets you tailor the data to how your customers actually buy. Once you know which metrics matter most to your team, ThoughtMetric's Custom Reports let you build a dashboard around them.
The brands that get the most out of attribution are the ones that check it frequently and use the data to make incremental spend adjustments.
Book a Demo
Want to see how multi-touch attribution works in ThoughtMetric? Book a demo.
Get full visibility into what drives your revenue.
You're spending on ads. We'll show you which ones matter.


.png)
.png)
