
%20(1200%20x%20650%20px).png)
Across 100 e-commerce brands, the average cart abandonment rate in October 2024 was 76.90%.
During Black Friday and Cyber Monday (BFCM) 2024, that number fell to 66.59%.
This drop shows how seasonal urgency influences buyer behavior. When discounts and limited-time offers are introduced, more shoppers move from browsing to buying. These benchmarks provide a helpful point of comparison as you evaluate your store’s performance during both high- and low-intent periods throughout the year.
Track Add to Carts by Channel
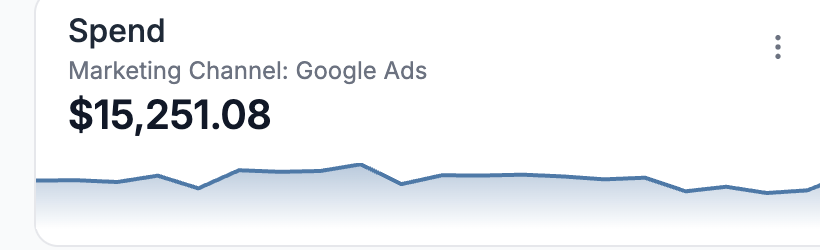
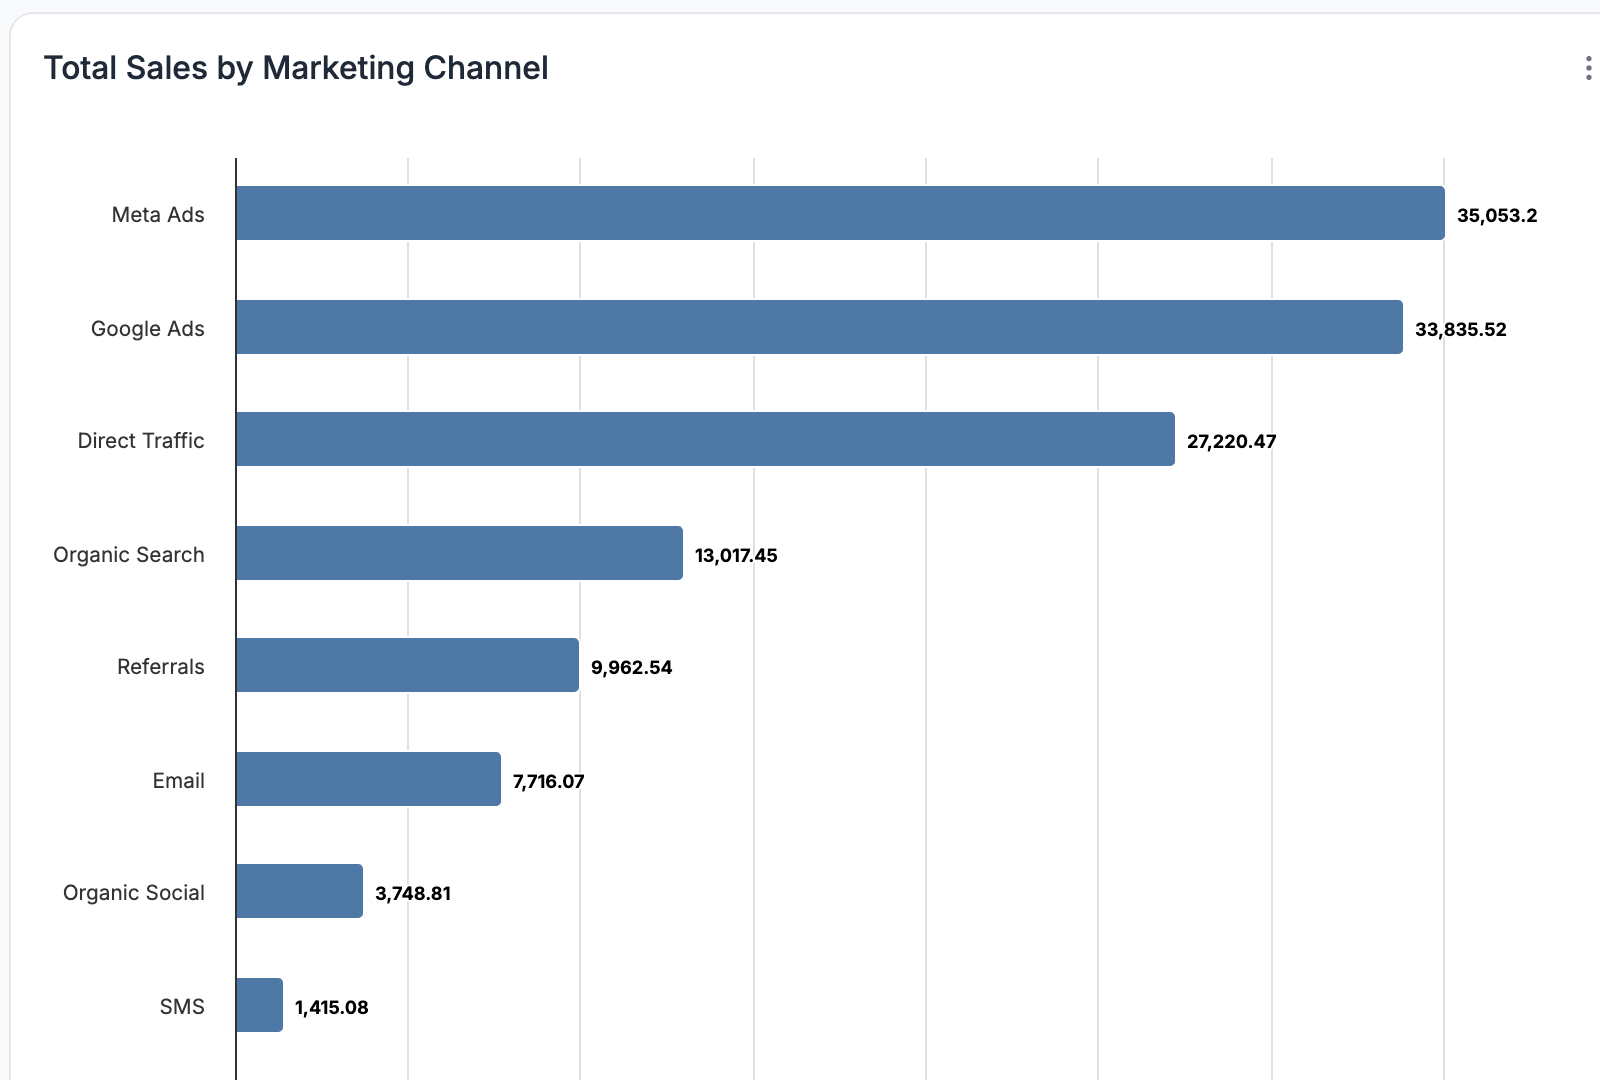
Understanding overall abandonment is useful, but the real insight comes from knowing where it happens. ThoughtMetric lets you track add to carts by channel, ad set, and ad, so you can see which sources drive high intent and which have higher drop-off rates.
For example, Meta Ads might bring strong traffic but higher abandonment, while Email or Organic Search tends to attract buyers who are ready to convert. By comparing add-to-cart and conversion rates across channels, you can identify where to focus optimization efforts, whether that means improving creative, adjusting offers, or refining retargeting campaigns.
Set Up Multi-Touch Attribution Before BFCM 2025
BFCM is the biggest shopping event of the year for most e-commerce brands, and preparation makes all the difference. Setting up multi-touch attribution ahead of time ensures that every channel, campaign, and touchpoint is tracked accurately before the rush begins.
When BFCM 2025 arrives, you will already have clear data showing where conversions are coming from, how channels interact across the funnel, and which efforts drive the highest return. That foundation allows you to make smarter, faster decisions during the sale and gives you accurate insights to guide your 2026 planning.
How ThoughtMetric Helps
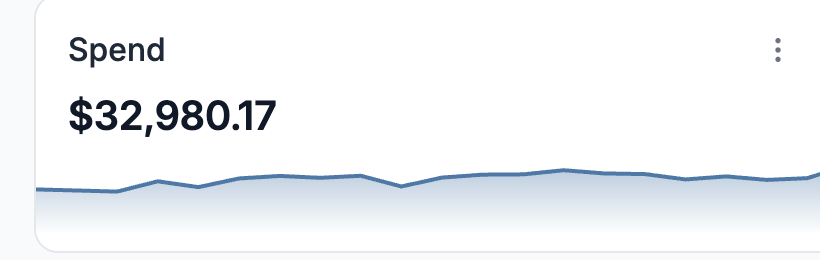
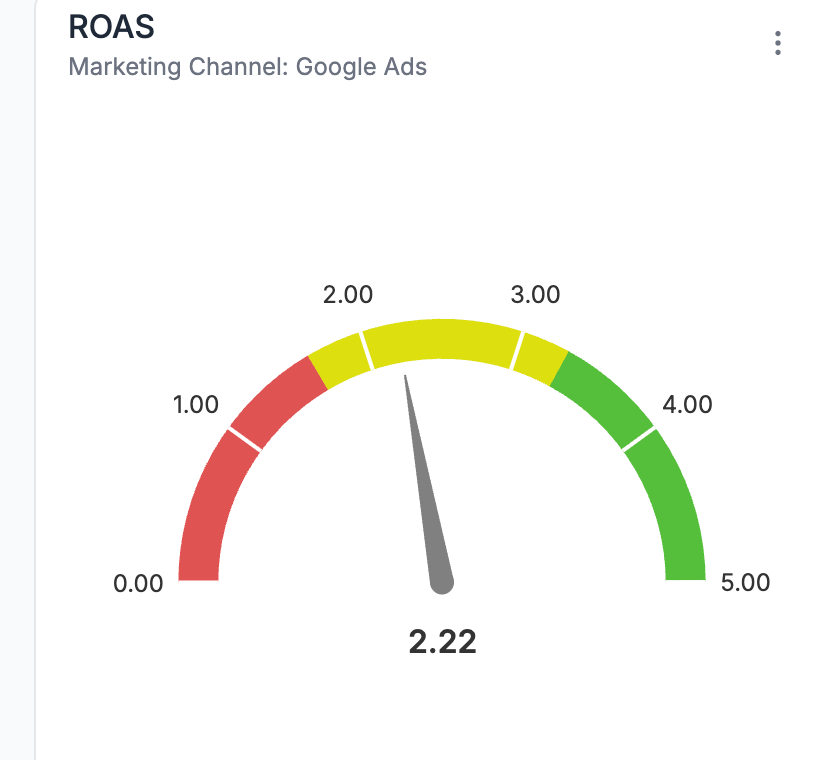
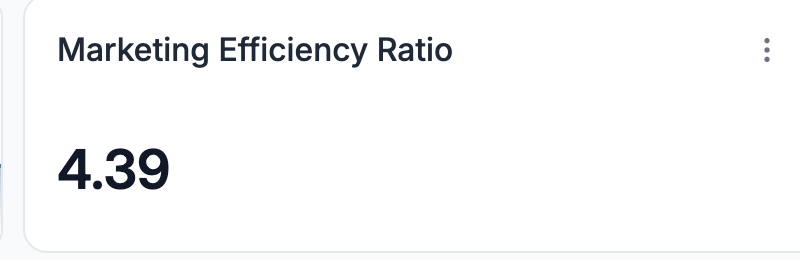
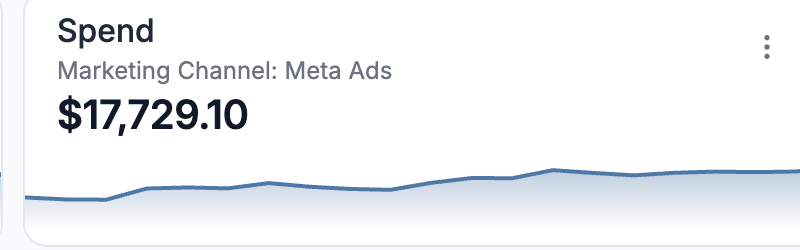
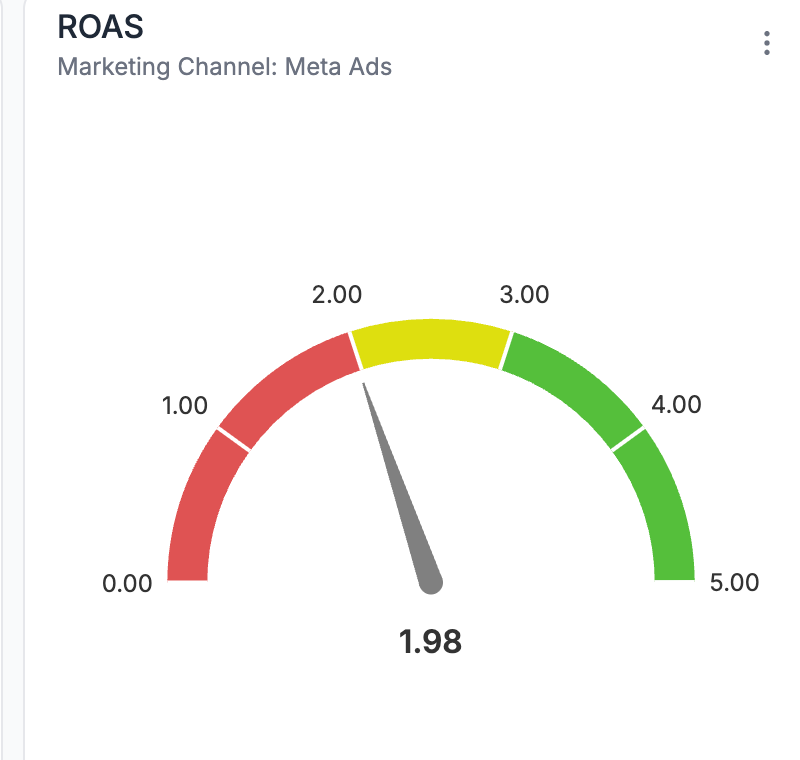
ThoughtMetric gives you full visibility into how shoppers engage with your store from the first click to the final purchase. You can track metrics such as add to carts, conversion rates, ROAS, LTV, AOV, and more to see how promotions and timing affect performance.
Because ThoughtMetric connects directly to your store, every event is captured accurately. You can compare campaigns, channels, products, and more, to understand what drives results and where to focus next.
When you can measure what influences shopper behavior, you can improve it.
Want to see how your brand compares? Book a ThoughtMetric demo to explore your own cart and checkout data.
FAQs
Can I compare add-to-cart performance across different traffic sources?
Yes. In ThoughtMetric, you can view add-to-cart performance by channel to see where shoppers drop off most often. This helps identify which traffic sources attract high-intent buyers versus browsers.
Yes. In ThoughtMetric, you can view add-to-cart performance by channel to see where shoppers drop off most often. This helps identify which traffic sources attract high-intent buyers versus browsers.
Can I track how abandonment changes during BFCM or other key sales periods?
You can easily compare any two time periods in ThoughtMetric using the date picker. For example, you can analyze October vs. BFCM to see how promotions or discounts affected conversion behavior.
How does multi-touch attribution improve my BFCM tracking?
Multi-touch attribution in ThoughtMetric shows how every channel contributes along the path to purchase. It gives you a full picture of what drives conversions during high-volume periods like BFCM, so you can plan next year’s campaigns with data-backed confidence.
Multi-touch attribution in ThoughtMetric shows how every channel contributes along the path to purchase. It gives you a full picture of what drives conversions during high-volume periods like BFCM, so you can plan next year’s campaigns with data-backed confidence.

.png)
