When it comes to ad budgets, e-commerce brands leaned heavily toward Meta in Q3 2025. However, the quarter also revealed how volatile spend can be across both platforms.
Meta Dominates Q3 Ad Spend
Across 100 e-commerce stores, Meta accounted for 77.9% of total ad spend, while Google Ads represented just 22.1%. This reinforces Meta’s position as the leading paid acquisition channel for many brands.
Month-Over-Month Spend Shifts
From July to August, Meta Ad Spend surged 39.4%, however, that momentum didn’t last. By September, Meta spend dropped 41.8%, the steepest decline of the quarter.
What This Means for Marketers
These trends highlight two key dynamics:
-
Meta spend is more reactive. Brands tend to scale it quickly when results improve, and pull back just as fast when performance dips.
-
Google spend is more stable. Search budgets typically follow consistent patterns, with smaller fluctuations tied to seasonal demand rather than algorithm changes.
See Your Own Spend Mix with Precision.
Track your channel performance and optimize your media budget with insights from ThoughtMetric. Book a demo to learn more.
FAQs
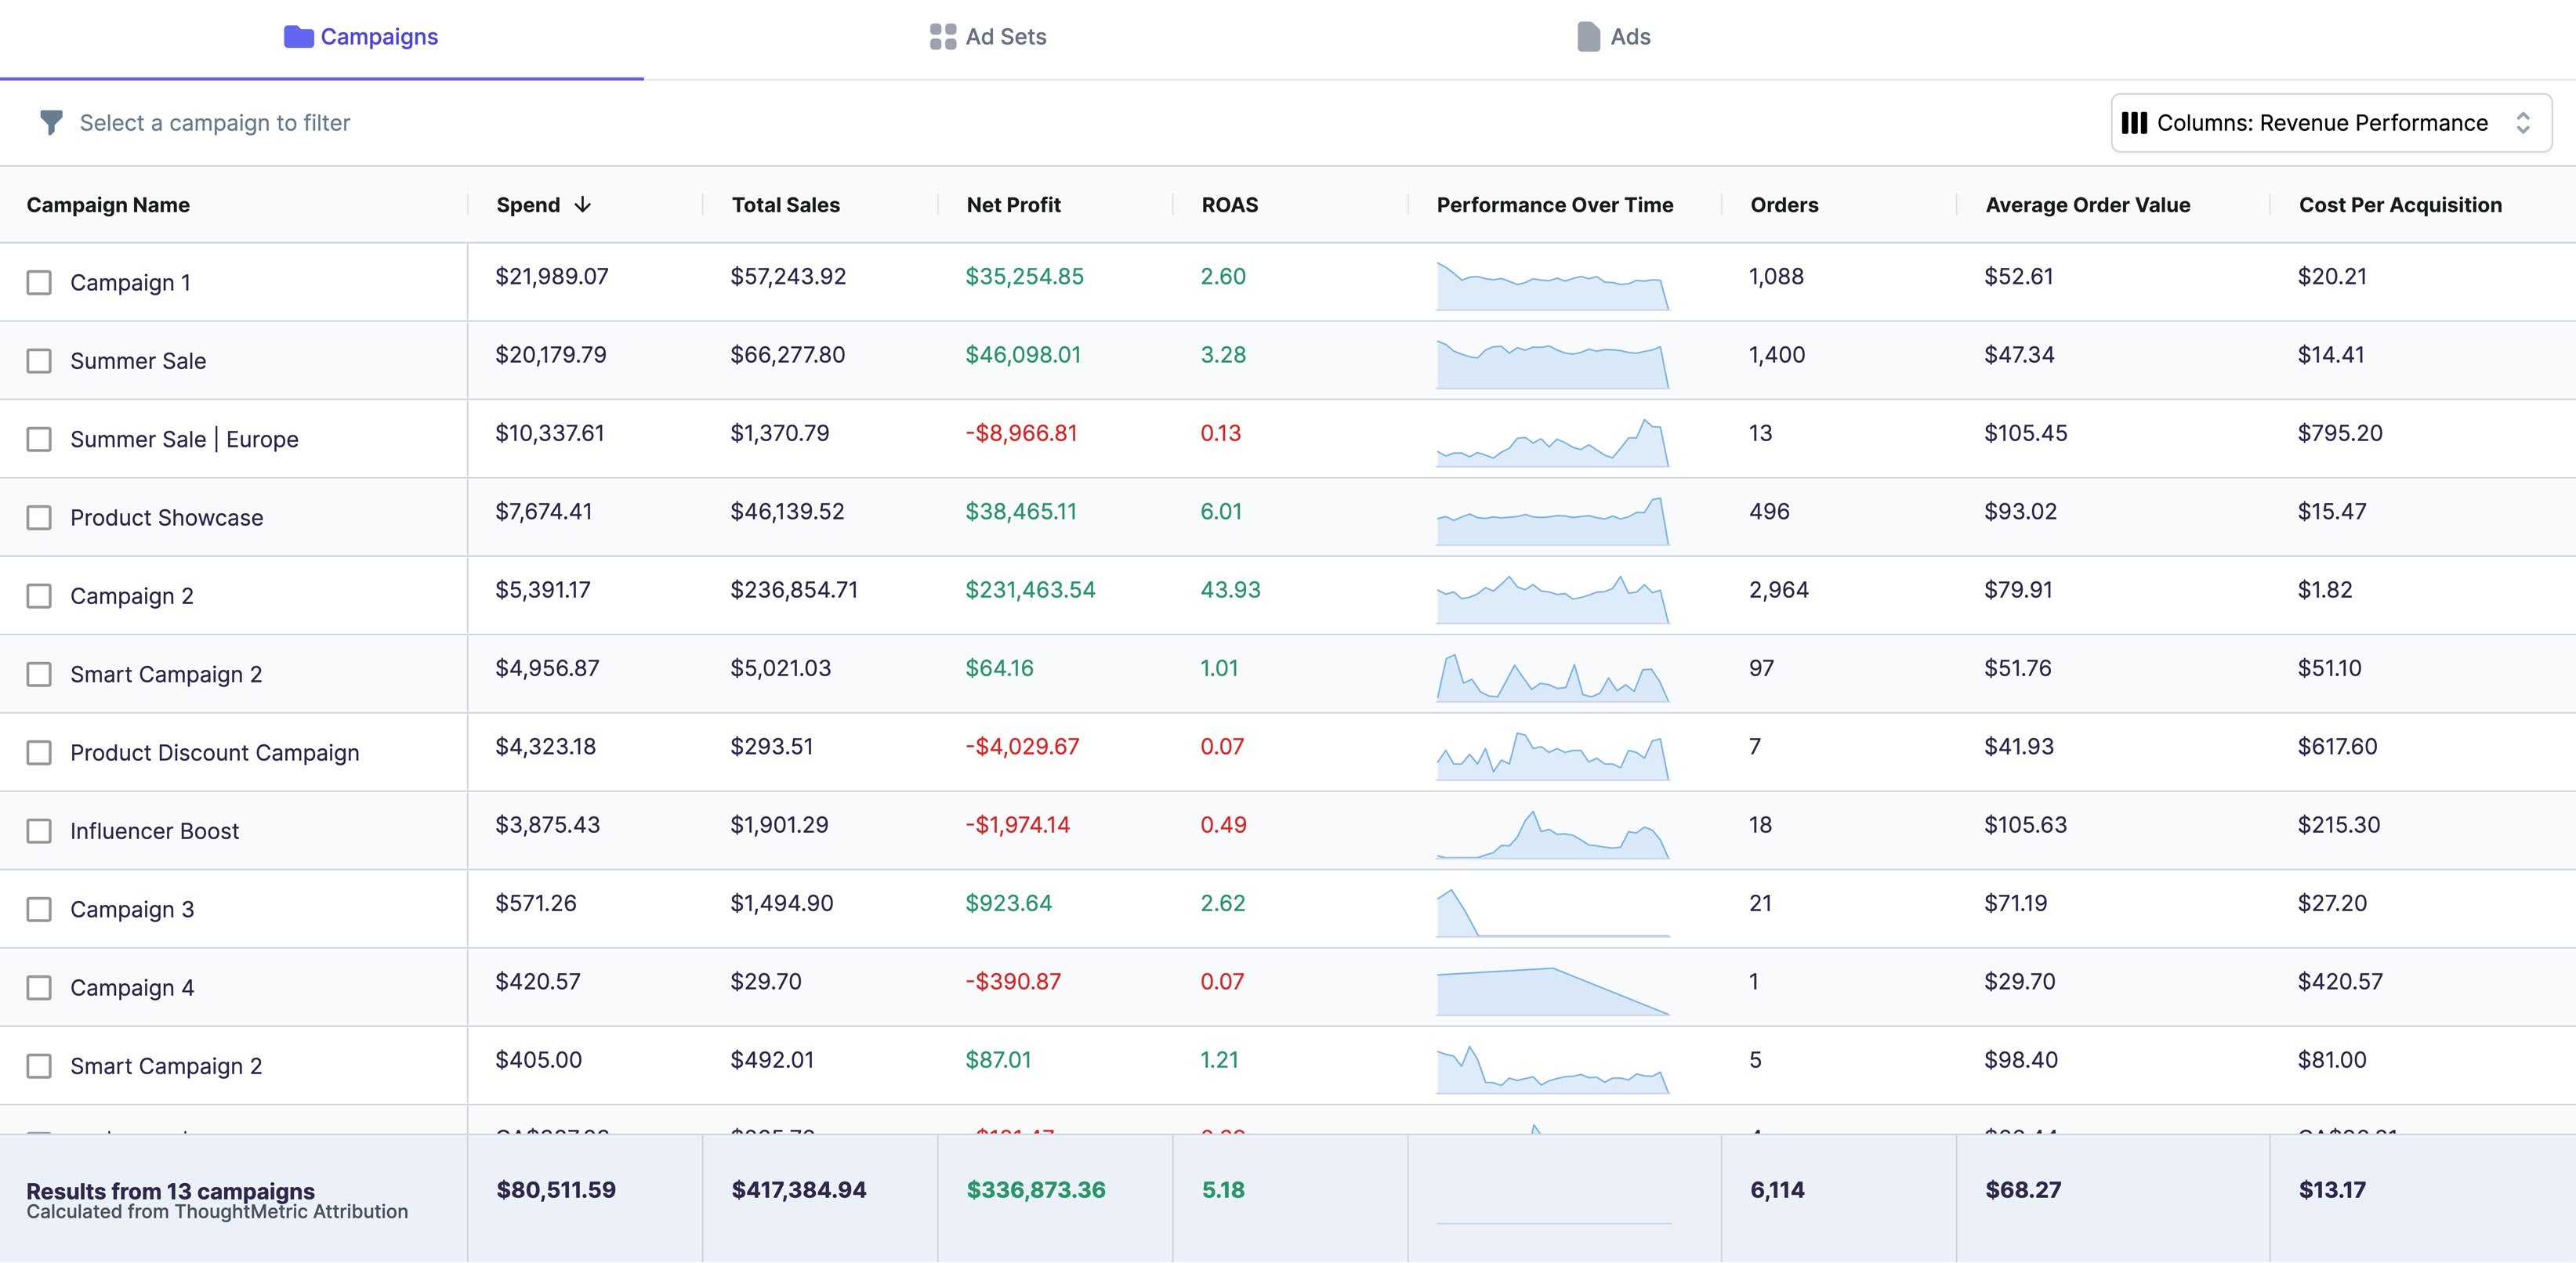
ThoughtMetric connects directly to your Google Ads, Meta Ads, and other marketing platforms. This allows you to see your total ad spend and performance data in one unified dashboard, no spreadsheets or manual exports required.
Yes. ThoughtMetric links ad spend to attributed revenue, so you can see not just where you’re spending, but which channels are actually driving sales. For example, if Meta spend drops but revenue holds steady, it could signal stronger efficiency.
Yes. With real-time spend and revenue tracking, you can spot underperforming channels early and shift spend toward higher-ROI sources, without waiting for end-of-month reports.


.png)