"We looked at a number of competitors in the space, but ultimately chose ThoughtMetric because of its easy-to-understand interface and the support offered during and after implementation."
"With ThoughtMetric, we were able to refine our analytics and provide verifiable proof of the revenue we were driving in a previously underperforming area of the business."
How Multi-Touch Attribution Shows Up in ThoughtMetric
Alex Fusco
May 07, 2025
Last Updated:
Ever wonder what actually convinced someone to buy from your store? Maybe they clicked a Google ad last night, saw your Instagram reel last week, and opened an email this morning.
Customers often take days (sometimes weeks) to make a decision. Therefore, why give all the credit to just one of those touchpoints?
At ThoughtMetric, we believe attribution should reflect the real customer journey, not just the last thing they clicked. That’s why we give you multiple ways to split credit across all the moments that mattered.
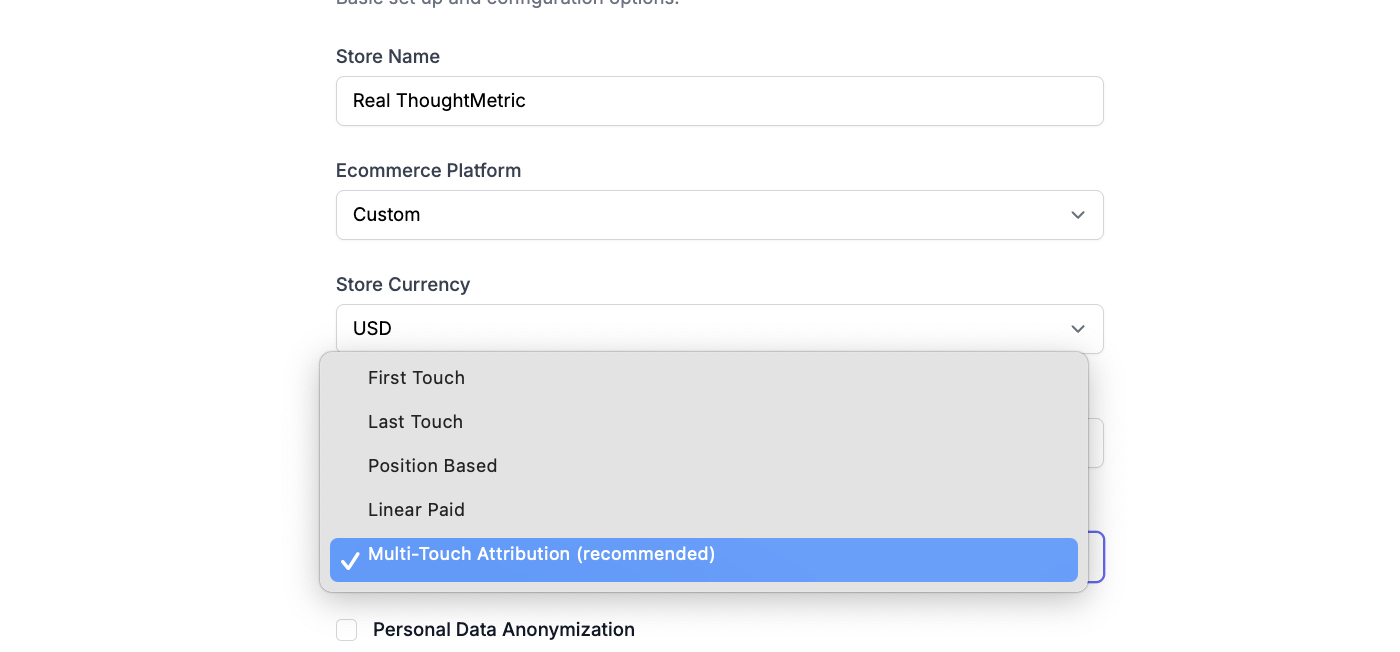
Choosing Your Attribution Model in ThoughtMetric
To get started, head to the Store Settings tab under the “Configure” section on the left-hand menu. This is where you’ll select your attribution model. Here's a quick breakdown of each option:
First Touch All the credit goes to the first ad or visit.
Last Touch Gives 100% of the credit to the last touchpoint before purchase.
Position-Based (U-Shaped) 40% goes to the first touch, 40% to the last, and the rest gets sprinkled across the middle.
Linear Paid Splits credit equally across every paid touchpoint so you can focus purely on ROI from ad spend.
Multi-Touch It combines multi-touch tracking and post-purchase survey data to show what actually influenced the sale, not just what got clicked.
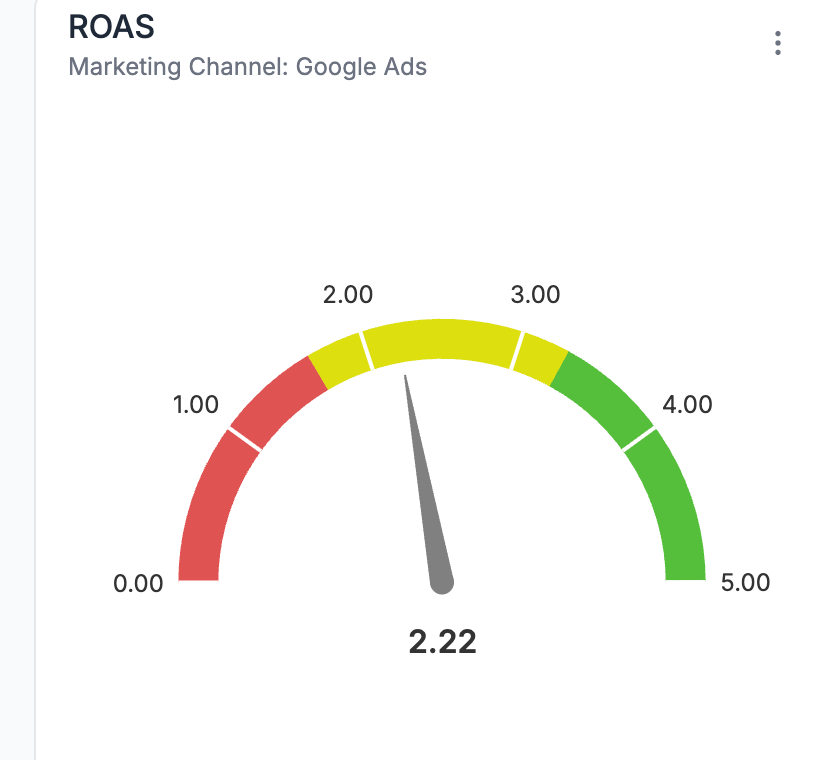
Where Attribution Shows Up in ThoughtMetric
Once your model is selected, you’ll start seeing the magic unfold throughout your account.
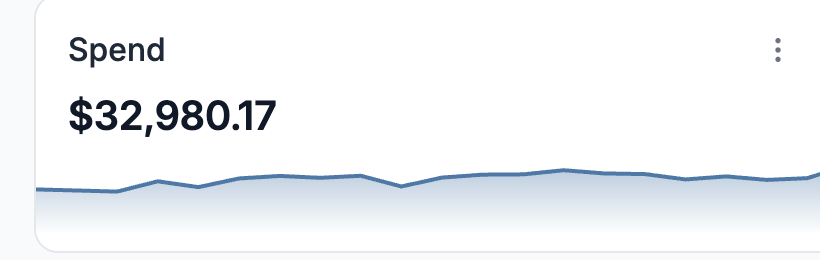
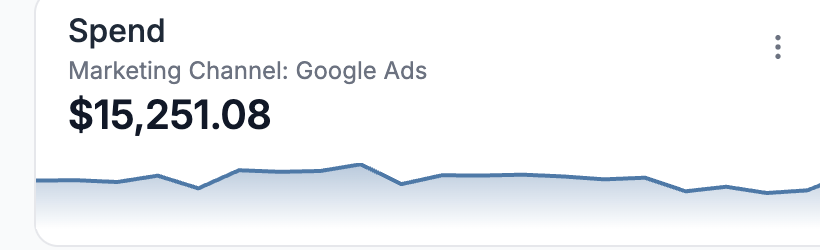
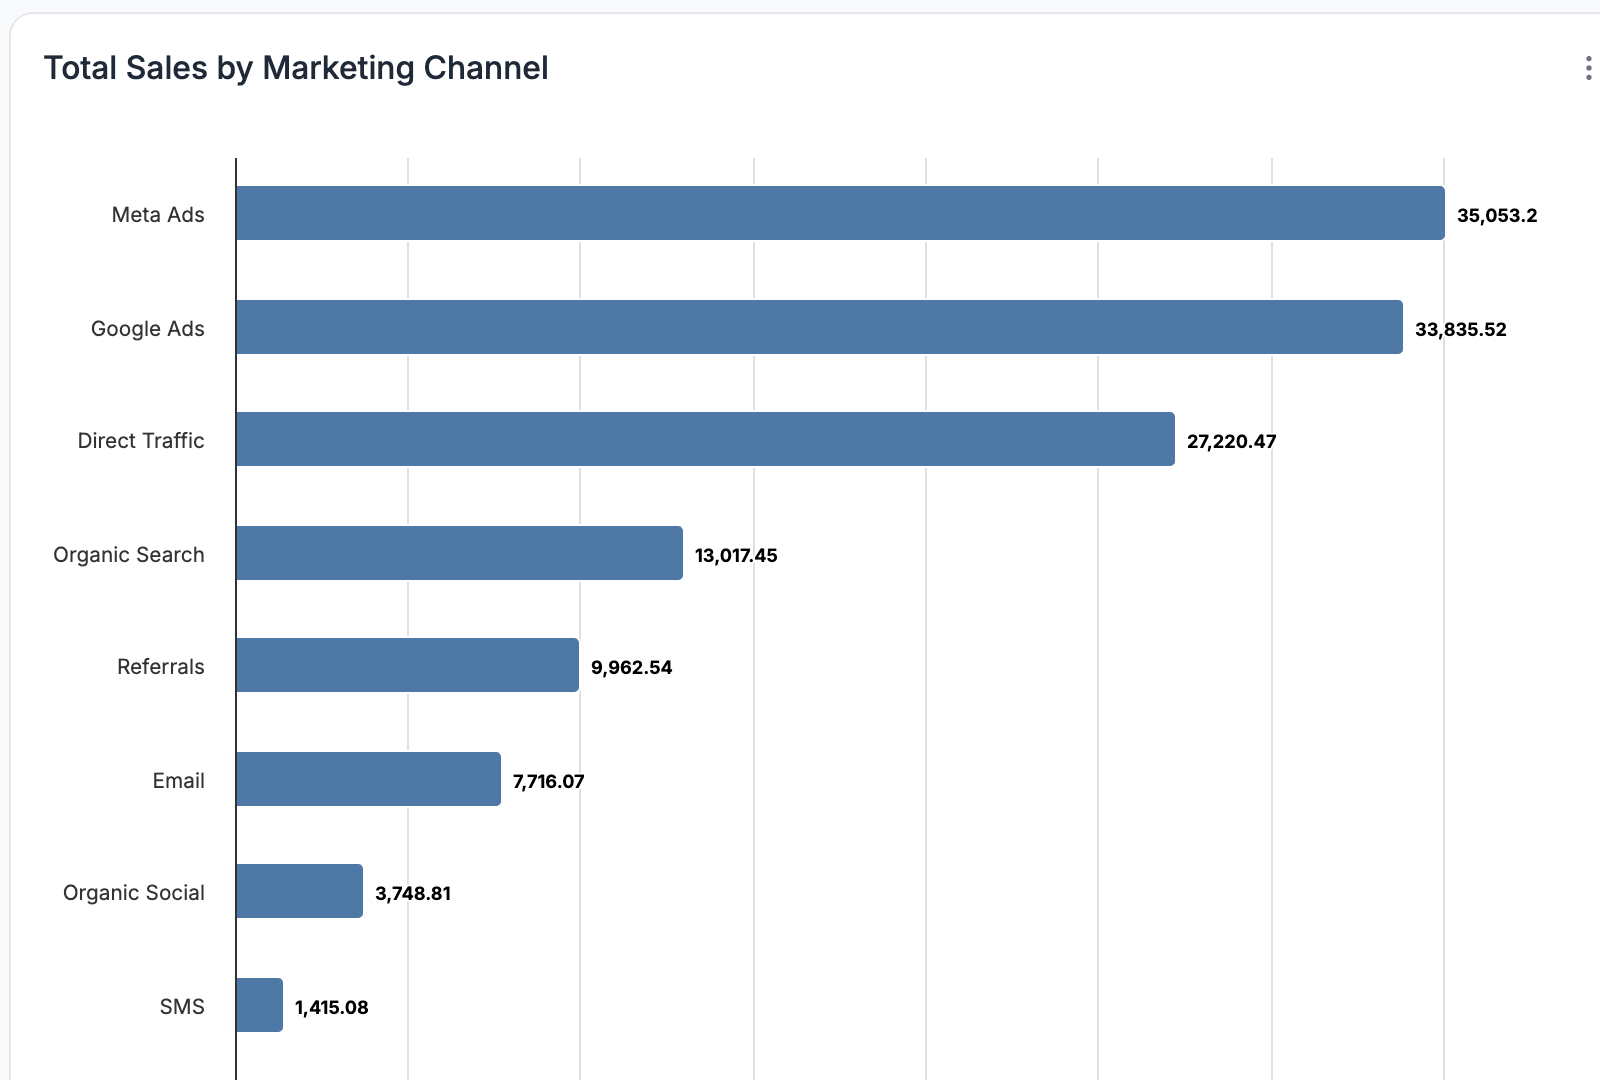
1. Summary Page: Sales by Marketing Channel
Here’s where it gets interesting — in the Orders column, some numbers have decimals. That’s because multiple channels shared credit for the same purchase.
For example, if someone clicked a Google ad and then purchased after opening an email, both platforms get a portion of the credit.
2. Orders Section
Each order shows icons for the channels that contributed, based on your selected model. So you might see a path like: Meta Ads → Google Ad → Referral Link → Purchase
3. Order Details
Click into any order to see a full breakdown:
A pie chart showing how credit was split
A step-by-step view of the customer’s journey, with time stamps and channels
Why It Matters
By seeing the full path to purchase, you can stop guessing what’s working, and start doubling down on the channels that actually drive revenue.
Get full visibility into what drives your revenue.
You're spending on ads. We'll show you which ones matter.


.png)
