Understanding margin in business can be tricky, but it is a critical concept that helps businesses analyze their financial performance. Google Analytics can be an excellent tool for measuring margin and gaining insights into your business.
Understanding Margin in Business
Margin is a fundamental concept in business that plays a critical role in determining the profitability of a company. In simple terms, margin refers to the difference between the revenue and the cost of goods sold. It is expressed as a percentage and shows how much profit a business makes on each sale.
What is Margin?
Margin is a financial metric that measures the profitability of a business. It is calculated by subtracting the cost of goods sold from the revenue and dividing the result by the revenue. For example, if a product costs $50 to produce and is sold for $80, the margin is 37.5%. This means that for every $80 sale, the business earns $30 in profit.
Margin is an essential metric for businesses of all sizes and industries as it provides insight into the financial health of a company. By analyzing margin data, businesses can determine if their products are priced appropriately and if their production costs are under control.
Importance of Margin in Business Analysis
Margin is a crucial performance metric for all businesses, as it indicates the profitability of their products or services. A high margin indicates that a business is generating a significant profit on each sale, while a low margin suggests that the business is struggling to make a profit.
Businesses can use margin data to analyze their pricing strategy and determine if they are charging enough for their products or services. If the margin is too low, the business may need to increase its prices or find ways to reduce its production costs to improve profitability.
Margin data can also help businesses identify areas where they can improve efficiency and reduce costs. For example, a business with a low margin may need to streamline its production process or negotiate better prices with suppliers to improve profitability.
In conclusion, margin is a critical metric for all businesses as it provides insight into the financial health of a company and helps businesses make informed decisions about pricing and production costs. By analyzing margin data, businesses can identify areas where they can improve efficiency and profitability, ultimately leading to long-term success.
Introduction to Google Analytics
Google Analytics is an essential tool that helps businesses monitor and improve their online performance. By providing detailed insights into website traffic and user behavior, Google Analytics helps businesses make informed decisions about their online strategies. With its powerful features, businesses can measure the effectiveness of their marketing campaigns, track e-commerce transactions and revenue, and gain valuable insights into website and user behavior.
Key Features of Google Analytics
Google Analytics offers a wide range of features that help businesses make informed decisions about their online strategies. Some of the key features include:
- Tracking website traffic and user behavior: With Google Analytics, businesses can track the number of visitors to their website, where they come from, and how they interact with the website.
- Measuring the effectiveness of marketing campaigns: Google Analytics allows businesses to track the performance of their marketing campaigns, including the number of clicks, impressions, and conversions.
- Tracking e-commerce transactions and revenue: With Google Analytics, businesses can track e-commerce transactions and revenue, including the number of sales, average order value, and conversion rate.
- Providing detailed website and user insights: Google Analytics provides businesses with detailed insights into website and user behavior, including pageviews, bounce rate, and time on site.
Setting Up Google Analytics for Your Website
Getting started with Google Analytics is easy. Here are the basic steps to set up an account and link it to your website:
- Create a Google Analytics account: To get started with Google Analytics, you will need to create an account. Simply go to the Google Analytics website and follow the instructions to create your account.
- Add a tracking code to your website: Once you have created your account, you will need to add a tracking code to your website. This code allows Google Analytics to track user behavior on your website.
- Define your website goals and conversions: To get the most out of Google Analytics, it is important to define your website goals and conversions. This will allow you to track the performance of your website and measure the success of your online strategies.
By following these simple steps, you can start using Google Analytics to monitor and improve your online performance. With its powerful features and detailed insights, Google Analytics is an essential tool for any business looking to succeed online.
Integrating Margin Metrics in Google Analytics
Identifying Relevant Metrics for Margin Calculation
Google Analytics is a powerful tool that can help you gain insights into your business's financial health. By tracking key metrics, you can identify areas where you can improve your profits and optimize your margins. Some of the most critical metrics that can be used to calculate margin include:
- Revenue: This metric represents the total income generated by your business over a specific period. It is a key metric for calculating your gross profit and net profit.
- Cost of Goods Sold (COGS): This metric represents the direct costs associated with producing and selling your products or services. It includes the cost of materials, labor, and other expenses directly related to production.
- Gross Profit: This metric represents the total revenue generated by your business minus the cost of goods sold. It is a key metric for calculating your gross margin.
- Net Profit: This metric represents the total income generated by your business minus all expenses, including COGS, operating expenses, and taxes. It is a key metric for calculating your net margin.
By tracking these metrics in Google Analytics, you can gain a better understanding of your business's financial performance and identify areas where you can improve your margins.
Creating Custom Metrics for Margin Analysis
While the standard metrics provided by Google Analytics are useful for margin analysis, you can also create custom metrics to track specific aspects of your business. Custom metrics allow you to refine your analysis and gain more specific insights into your business.
For example, you could create a custom metric to measure the cost of advertising campaigns or the cost of shipping. By tracking these costs separately, you can gain a better understanding of how they impact your margins and identify ways to optimize your spending.
Creating custom metrics in Google Analytics is easy. Simply navigate to the Admin section of your account, select the Property you want to create the metric for, and click on Custom Definitions. From there, you can create a new custom metric and define the parameters you want to track.
By integrating margin metrics and custom metrics into your Google Analytics account, you can gain a comprehensive view of your business's financial health and identify areas where you can improve your margins and profitability.
Calculating Margin Using Google Analytics Data
Analyzing Revenue and Cost Data
To calculate margin using Google Analytics data, you will need to analyze your revenue and cost data. This data can be found in the e-commerce reports or by setting up custom reports in Google Analytics. Once you have your revenue and cost data, you can calculate the gross margin by subtracting the cost of goods sold from the revenue and dividing by the revenue.
Determining Gross Margin
Gross margin is a critical metric that determines how much profit a business makes on each sale. To determine gross margin, you need to subtract the cost of goods sold from the revenue and divide by the revenue. The resulting percentage represents the profit margin on each sale.
Calculating Net Margin
Net margin takes into account all the expenses associated with running a business, including overhead costs, salaries, and taxes. To calculate net margin, you need to subtract all expenses from the revenue and divide by the revenue. The resulting percentage represents the profit margin after all expenses have been accounted for.
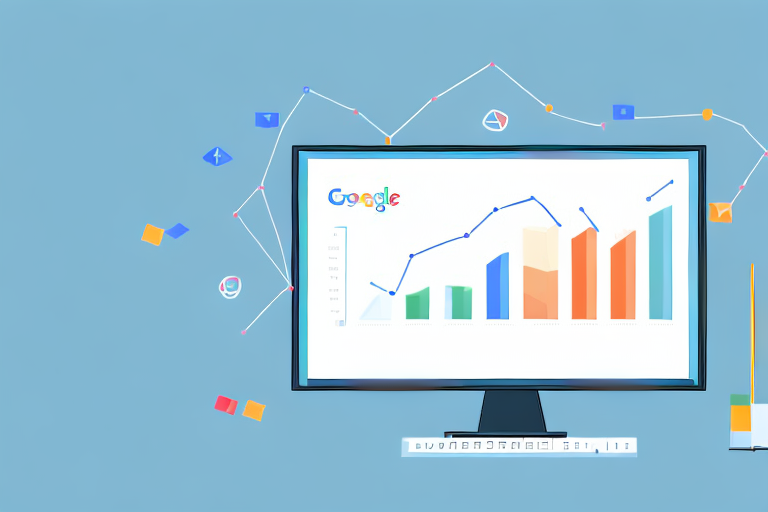
Visualizing Margin Data in Google Analytics
Building Custom Dashboards for Margin Analysis
Google Analytics allows you to create custom dashboards that can be used to visualize and analyze margin data. You can create custom dashboards that focus on specific metrics or aspects of your business, such as sales by region or product line. Custom dashboards allow you to gain a more in-depth understanding of your business performance and identify areas where you need to improve.
Utilizing Google Data Studio for Advanced Visualization
Google Data Studio is a powerful data visualization tool that can be used to create custom reports and visualizations based on your Google Analytics data. With Google Data Studio, you can create interactive dashboards and reports that give you a more detailed view of your margin data. This tool allows you to create visually appealing reports that are easy to understand and share with others.
In conclusion, calculating margin in Google Analytics is an essential aspect of business analysis. By using the powerful features of Google Analytics, businesses can gain valuable insights into their financial performance and make data-driven decisions that improve their bottom line.